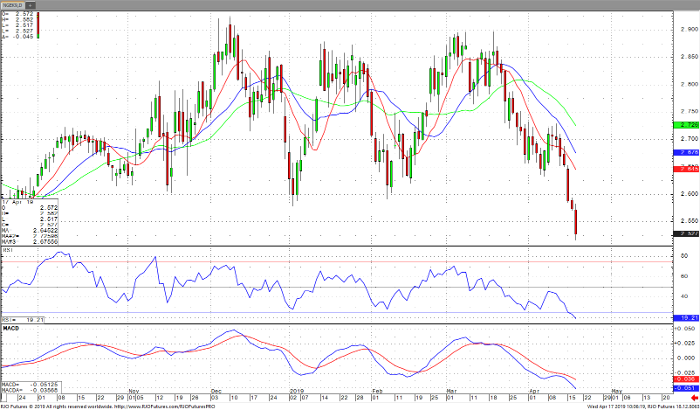
Today’s trend in May natural gas is decidedly down. The support levels have been breached, and the last seven days have lower highs and lows. The pivot point today is $2.55, resistance comes in around $2.59 then $2.69 and $2.74. Support has been broken at $2.59 has been as low as $2.517. Support now rests at $2.50 and $2.41. The short-term MA’s and the momentum studies are all pointed toward down. Is the bottom in? The last daily bar looks like a reversal to me, but no technical or fundamental reasons are evident.
Higher temperatures are in the forecast, spring has finally arrived, and in Chicago we had snow Sunday. Monday and Tuesday were back in the 70’s. It is almost, but not quite cooling season, so demand there has not gained footing. There are other reasons gas is very cheap. Foreign production is up and Russia suggests a slight uptick in production as well. Gas received a 25 bcf injection last week. Tomorrow’s numbers are not in yet, but caution is advised going forward. A close above $2.60 is needed to change the trend, anything else will keep the market going in the same direction.
Natural Gas May ’19 Daily Chart


