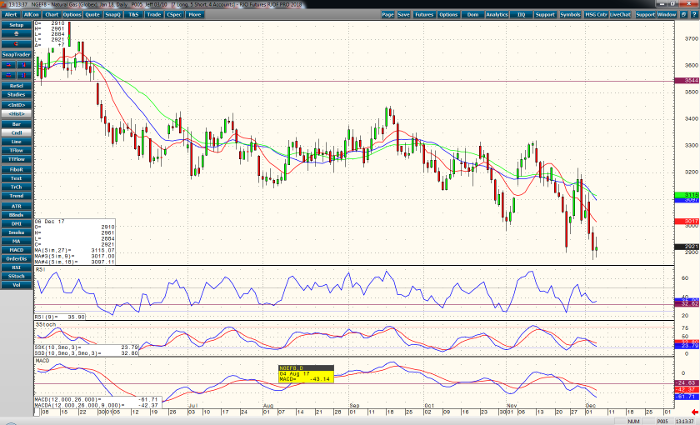
The trend in January natural gas has shifted back to a bearish chart pattern. The nearby low of 2.875 has established new support and resistance numbers to base our current bearish exposures on. A close above the past two day high of 2.998 and 3.127 are needed to negate the current trend and give control back to the bulls. A close below 2.911 could signal a sell-off back toward the Feb 2016 low of 2.720. Prices may consolidate in the 3.200 to 3.300 range. The upper limits of the range can be used as longer term resistance to base trend reversals on.
The close beneath the 9, 18, and 27-day moving averages is bearish. Momentum studies have dropped from overbought levels and should accelerate selling in the market if stops are triggered.
A draw of -5 bcf is expected because of milder weather going into the report. A surprise larger draw may bring buyers into the equation. A draw near -5 should continue the current trend.
A slightly colder 6-10 day forecast is expected for most of the US. The Midwest should struggle to see highs above the freezing point. After that normal, more seasonal weather is expected. Bearish to neutral positioning are recommended.
Natural Gas Jan ’18 Daily Chart


