Posted on Dec 11, 2023, 10:12 by Dave Toth
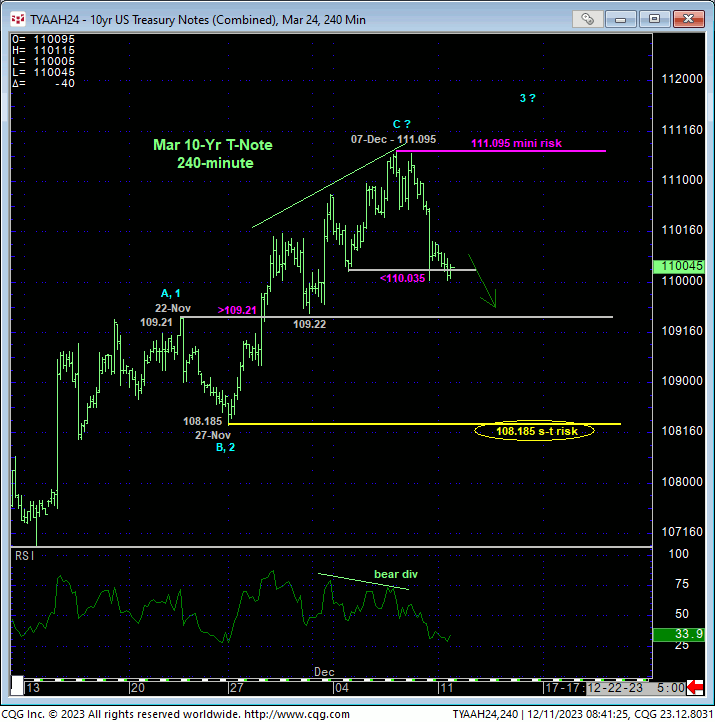
On a short-term basis, the 240-min chart below shows Fri’s relapse below a very minor corrective low from 04-Dec at 110.035 confirming a bearish divergence in short-term momentum. This mo failure defines 07-Dec’s 111.095 high as one of developing importance and a mini parameter from which non-bullish decisions like long-covers and cautious bearish punts can be objectively based and managed by short-term traders with tighter risk profiles.
This chart also shows the market still ABOVE former 109.21/.22-area resistance-turned-support from late-Nov as well as 27-Nov’s next larger-degree corrective low at 108.185. As we’ll discuss below from a longer-term perspective, to defer or threaten a broader base/correction/reversal count, the market should be expected to weaken below AT LEAST the 109.21-area and preferably below 108.185. Per such, this 108.185 level remains intact as a bull risk parameter pertinent to intermediate-term traders.
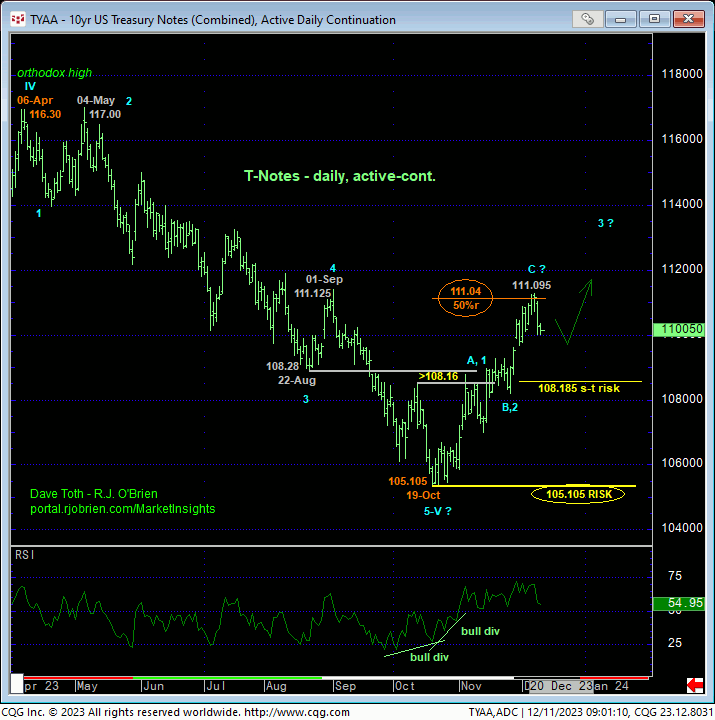
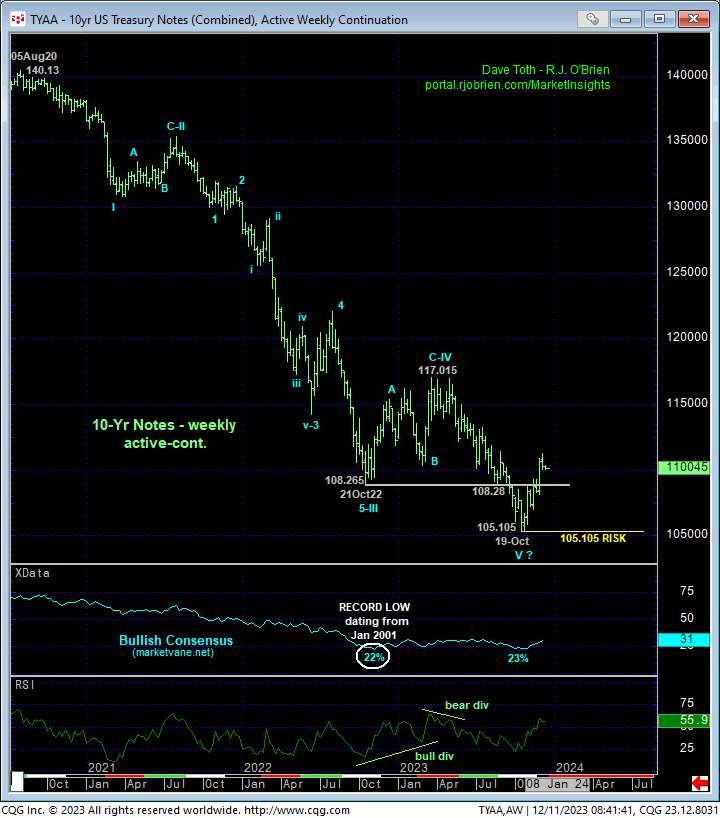
Moving out to a daily chart of the contract (above) and weekly chart (below), the challenge and debate is in full swing as to whether the recovery attempt from 19-Oct’s 105.105 low is another correction within the secular bear market or a reversal that could easily be major in scope, spanning at least quarters. The 7-week rally from 105.105 is not unimpressive and we’re setting aside the often times dubious exercise of trying to discern whether a recovery like this is a corrective 3-wave affair or an impulsive 5-wave event as the start of a more protracted reversal.
What we know to true as facts are:
- AT LEAST the intermediate-term trend is up
- weakness below at least 108.185 is required to break this trend
- the 7-week recovery has thus far stalled around the (111.04) 50% retrace of Apr-Oct’s 116.30 – 105.105-PORTION of the 3-YEAR secular bear market
- the futures contract has failed to sustain Sep/Oct losses below key former support-turned-resistance from the 108-3/4-area from Oct’22
- market sentiment/contrary opinion levels have been and remain at understandably historically bearish levels typical of major base/reversal environments.
An “observation” (as opposed to a fact) is that Apr-Oct’s portion of the secular bear trend could be the completing 5th-Wave of a massive Elliott sequence down from Aug’20’s 140.13 all-time high. Another observation is that the past seven weeks’ recovery remains well within the bounds, thus far at least, with every other correction within the 3-year secular bear trend.
From a SCALE perspective, we can conclude 19-Oct’s 105.105 low as THE END of a textbook 5-wave sequence down from 06-Apr’s 116.30 orthodox high. Concluding the end of a 38-MONTH bear market from 140.13 would be grossly premature at this juncture.
From a positioning perspective and save for very short-term traders, a cautious bullish policy remains advised with a failure below 108.185 threatening this call and warranting defensive measures commensurate with one’s personal risk profile. A relapse below 105.105 negates any/all bullish counts and reinstates the secular bear market to indeterminately lower levels warranting the cover of any remaining bullish exposure and reversal into a resumed bearish stance. To resuscitate a more immediate bullish count, the market needs to recoup last week’s 111.095 high. Please keep these futures contract flexion points in mind as we now look at actual 10-yr yields below.
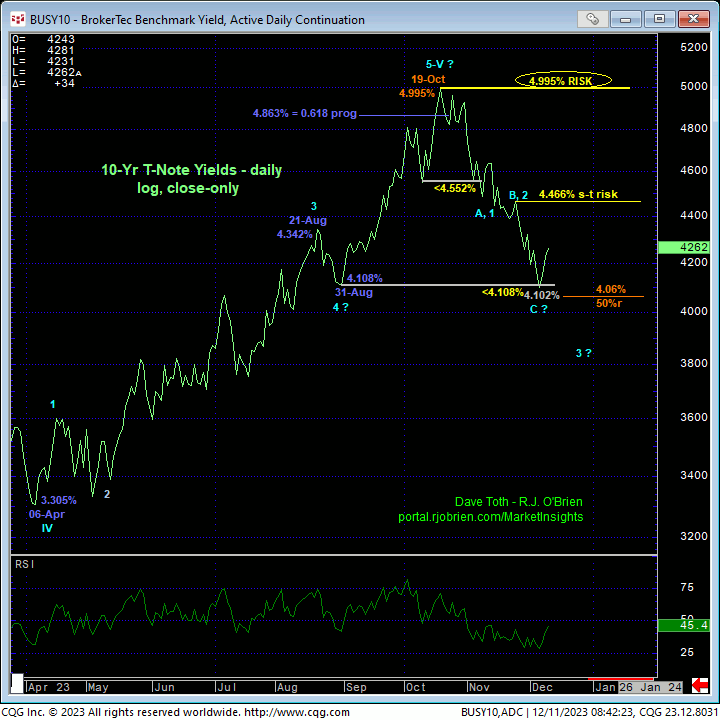
Similarly but inverted, the DROP in 10-yr rates from 19-Oct’s 4.995% high daily close (above) to 06-Dec’s 4.102% low close is not unimpressive and leaves highs in its wake at 4.466% and especially 4.995% as the rates this market needs to recoup to threaten and then negate a policy calling for lower rates. These rate levels are analogous to the 108.185 and 105.105 bear risk parameters in the contract.
UNlike the futures contract however, the weekly close-only chart of 10-yr yields below shows the recent rate relapse thus far holding around the immediate area of Oct’22’s key 4.21% high. Against the backdrop of 39-MONTH, 440-bp rise in rates, the recent setback in rates is a relative and potentially corrective drop in the bucket.
MIGHT have 19-Oct’s 4.995% high completed the 39-month rise in rates, started a major rate reversal lower and inform the Fed that the market is saying it’s OK for them to start cutting??? Yeah, sure. But given the key technical and trading matter of SCALE and risk assumption commensurate with one’s personal risk profile, we believe it to be grossly premature to conclude such at this juncture.
At best, the market has only satisfied two of our three key reversal requirements:
- a bearish divergence in interest rate momentum and
- (potentially) an impulsive 5-wave sequence down from 19-Oct’s 4.995% high rate.
The market has yet to satisfy the key third of our three reversal requirements: proof of 3-wave corrective behavior on a subsequent recovery attempt.
The forces that have driven this 39-MONTH explosion in interest rates are not going to evaporate quickly, despite every investor’s hope and prayer that the Fed will soon lower rates. Rather, peak/reversal processes of this magnitude typically take TIME and include corrective rebuttals that can be extensive. Herein lies the importance of the short- and longer-term risk parameters we’ve identified at 4.466% (108.185) and especially 4.995% (105.105).
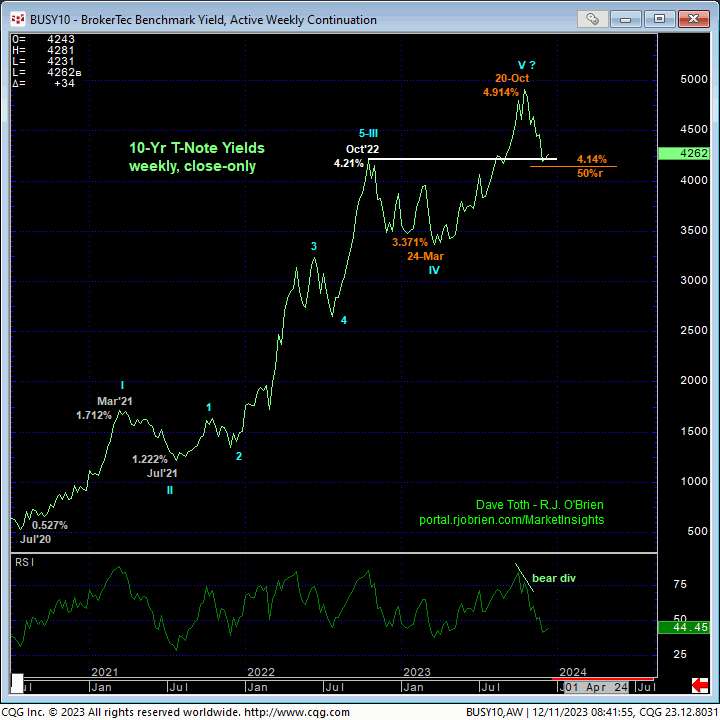
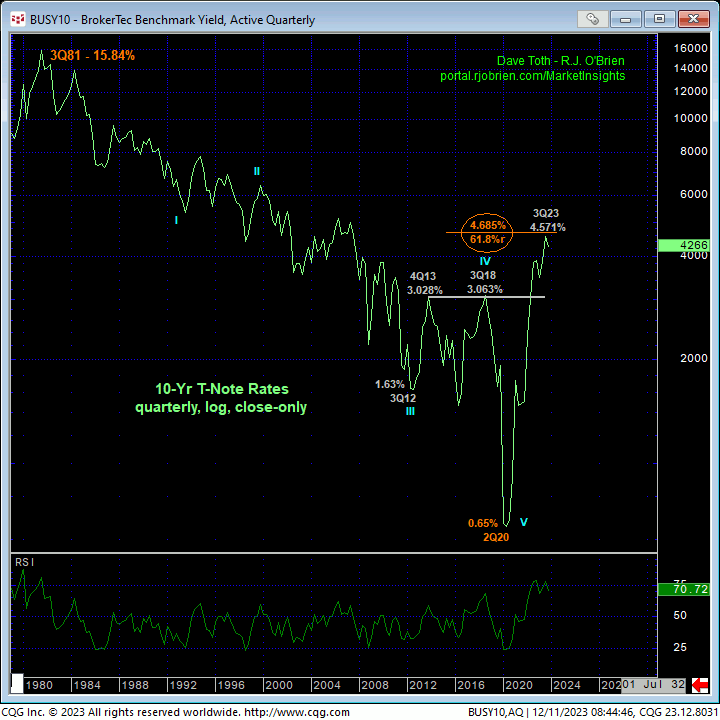
Lastly, what’s worth keeping in mind is that it took only a skosh more than three years for this market to retrace 61.8% of the entire 39-YEAR generational decline in 10-yr rates from 15.84% in 1981 to 0.65% in 2Q2020. This is a technical event of extraordinary scope, the ramifications of which, we believe, will dwarf everyone’s hyper-focus on each month’s inflation data and how soon it will be before the Fed starts easing.
Are the technical elements typical of a major top in rates in place? Yes, as long as corrective rebounds fall shy of 19-Oct’s 4.995% high and key long-term directional risk parameter. A smaller-degree bounce above 4.466% will at least defer a reversal lower in rates and may be an early indication of a resumption of the secular move higher in rates. Traders and investors are advised to toggles directional biases and exposure around these levels commensurate with their personal risk profiles.
