(NOTE: While the unprecedented and explosive rally in bitcoin is even more protracted then those that are unfolding across the grain complex, our introduction yesterday about the technical discipline required to more successfully navigate the corn, bean and meal markets under such major up-trending circumstances and perceived frothy heights applies equally to bitcoin. So we’re reiterating this introduction and applying it to bitcoin before addressing specific levels around which to more objectively base trading decisions.)
There’s not anyone involved in the bitcoin market today who’s not wondering two things:
- how high will prices continue to be driven up and
- when do I need to start thinking about a top and reversal and taking profits and/or hedging the downside?
Before addressing bitcoin technical specifics below, we’d first like to discuss a few tactical issues that needs to be understand, acknowledged and deployed.
The simple and pretty much only answer to the first question is, there’s no way to know. That’s because the proverbial “trend is your friend” and it will remain intact until a confirmed bearish divergence in momentum stems it. Over the past months we’ve seen a ton of markets that all serve as poster children for ignoring all references to a market being “overbought”. “Overbought” (and “oversold”) references are outside the bounds of technical discipline and are never, ever applicable in the business of markets in any way other than a mocking or satirical way.
The most effective and objective way to navigate a trend reversal or even a corrective interruption is via MOMENTUM indicators like RSI, stochastics, rate-of-change, etc. (the math is different in each one, but they all do the same thing). Trends, like freight trains, typically slow down before they reverse. In Dow theory terms this would be the left-shoulder of an eventual head-&-shoulders pattern before the bull fails to maintain the “head’s” gains. In Elliott Wave terms, such a slowdown process would be the 4th-wave correction before the final 5th-wave resumption of the bull before the market “fails” below the 4th-wave’s corrective low and CONFIRMS the trend break. Exact same price action, only different theory or language ways to say it.
We define a CONFIRMED bearish (in this case) divergence in momentum by either a 1) failure below a prior corrective low or 2) a relapse below an initial counter-trend low. Either occurrence will 1) confirm at least the short-term trend as down and, 2) MOST IMPORTANTLY, reject/define reliable, market-defined highs and resistance from which non-bullish decisions like long-covers can only then be objectively based and managed. If we’re going to make non-bullish decisions like long-covers in bitcoin, then we need to be able to identify a specific and objective risk level where that decision is WRONG. This can ONLY be done AFTER a confirmed bearish divergence in momentum. And as we’ll show below, thus far, the bitcoin market has provided no such evidence.
Another key technical and tactical issue is SCALE. Traders and analysts CANNOT conclude longer-term events from shorter-term events. We can not conclude a major top in bitcoin from a mere bearish divergence in hourly momentum. Given the magnitude and uninterrupted nature of the currently unfolding and massive rally however, we can identify admittedly very short-term risk parameters that will objectively allow shorter-term traders to take profits and stand aside to avoid the depths unknown of a more protracted correction AND for long-term institutional players to exchange acknowledged whipsaw risk (back above whatever high is left in the wake of a short-term mo failure) for deeper nominal risk on a portion of their position.
With these considerations and technical discipline in mind, let’s look at this extraordinary bitcoin market in detail.
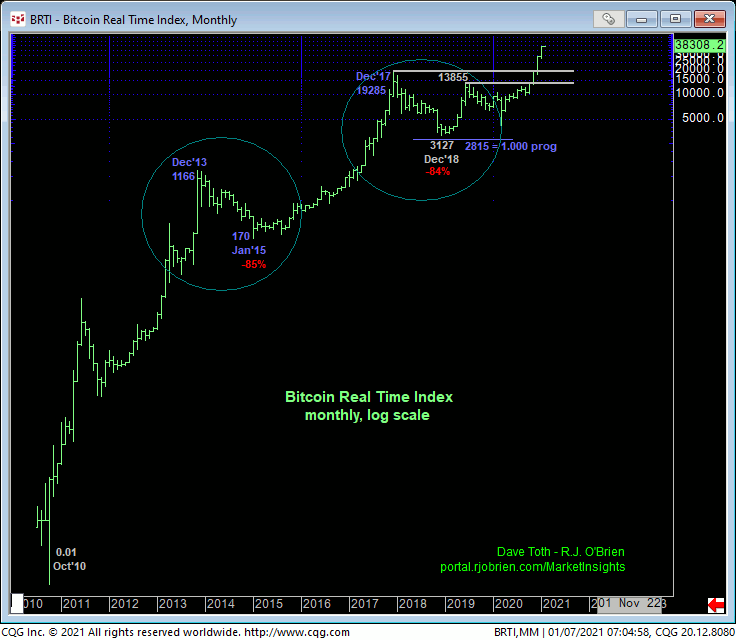
While recent nominal gains have been extraordinary this year, the monthly log scale chart of the underlying Bitcoin Real Time Index below shows that they are blown away by the percentage gains earlier in the past decade. It’s also interesting to note that the recent 2017 – 2018 correction from Dec’17’s 19285 high spanned a virtually identical length to that the preceding correction that unfolded from Dec’13’s 1165 high to Jan’15’s 170 low (84% drawdown vs an 85% drawdown).
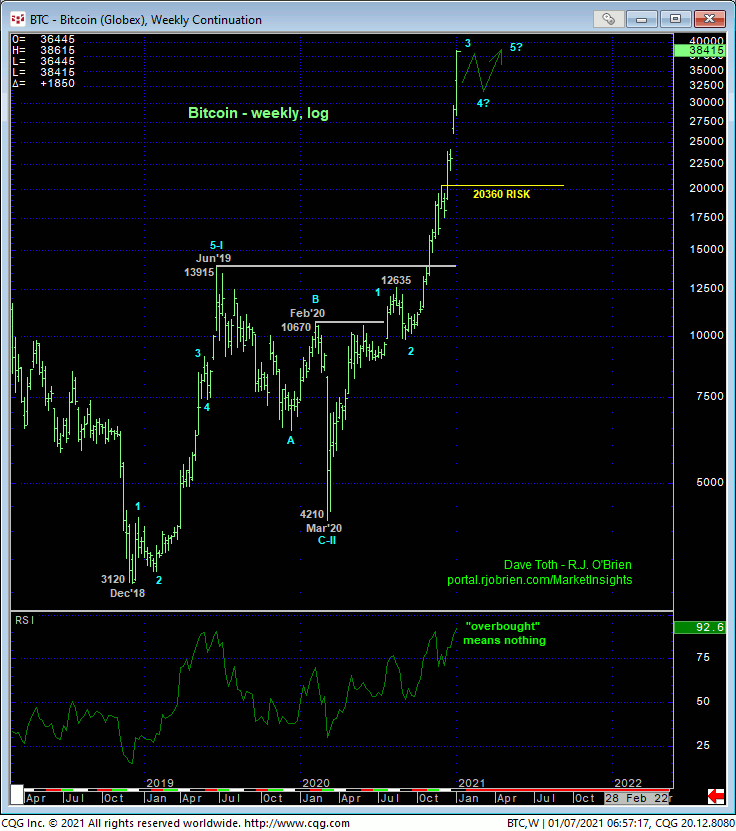
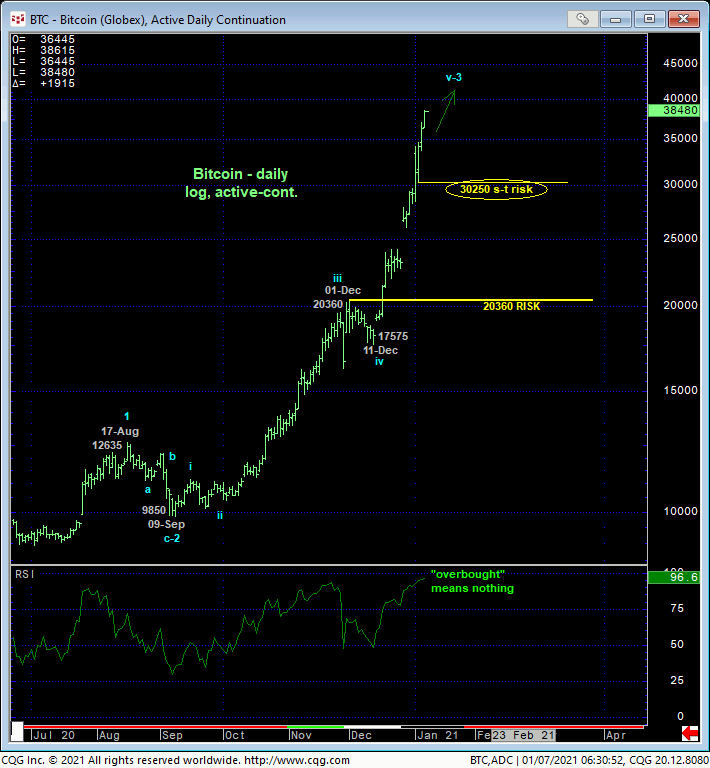
The weekly (above) and daily (below) log scale charts of the CME contract show the magnitude and magnificence of this year’s rally. The uptrend remains clear and present and should not surprise by its continuance or acceleration. Quite simply, an uptrend is defined by higher highs and higher lows. From a MOMENTUM standpoint then, we have to ask what level (i.e. corrective low) this market needs to fail below to even defer, let alone threat this uptrend.
On this scale and as a result of the steep and uninterrupted nature of the bull, 11-Dec’s 17575 low serves as above the only corrective low we can identify that the market would be required to fail below to break even the portion of the bull trend from 09-Sep’s 9850 low, let alone the secular bull trend from Dec’18’s 3120 low. Not that 01-Dec’s 20360 high and former resistance-turned-support is that much more practical, but we believe that to threaten the secular bull trend the market would have to relapse below at least 20360. Given the magnitude of the secular bull, indeed, even a relatively small but nominally steep setback to 30000 or 25000 would/could easily fall within the bounds of a mere (4th-Wave) correction.
As it seems impractical to give up nearly half of the market’s value from current 38000-handle prices for even institutional players to take defensive steps, we can drill down to even shorter-term scales to identify corrective lows and risk parameters and acknowledge the exchange of whipsaw risk for much steeper nominal risk.
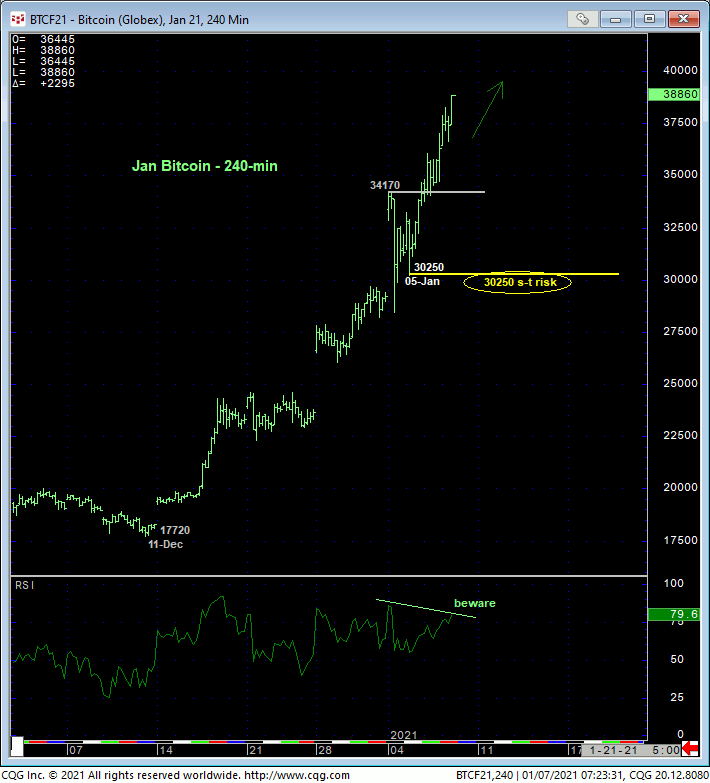
The intra-day 240-min chart above details the latest portion of the bull trend from 11-Dec’s 17720 low where yesterday and overnight’s resumed rally above Mon’s 34170 high leaves Tue’s 30250 low in its wake as the latest smaller-degree corrective low this market is now required to fail below to CONFIRM the threatening bearish divergence in momentum. This is a technical fact. So this 30250 level serves as a shorter-term risk parameter from which traders can objectively base and manage the risk of a still-advised bullish policy and exposure. Even at 30250 however, traders would still be giving back more than 25% of the market’s value. But this is the precise nature of a beast that has exploded over 120% in just the past month. What is NOT recommended to do is pick out “any level” out of thin air around which to make emotional and/or subjective decision. This lacks all technical discipline.
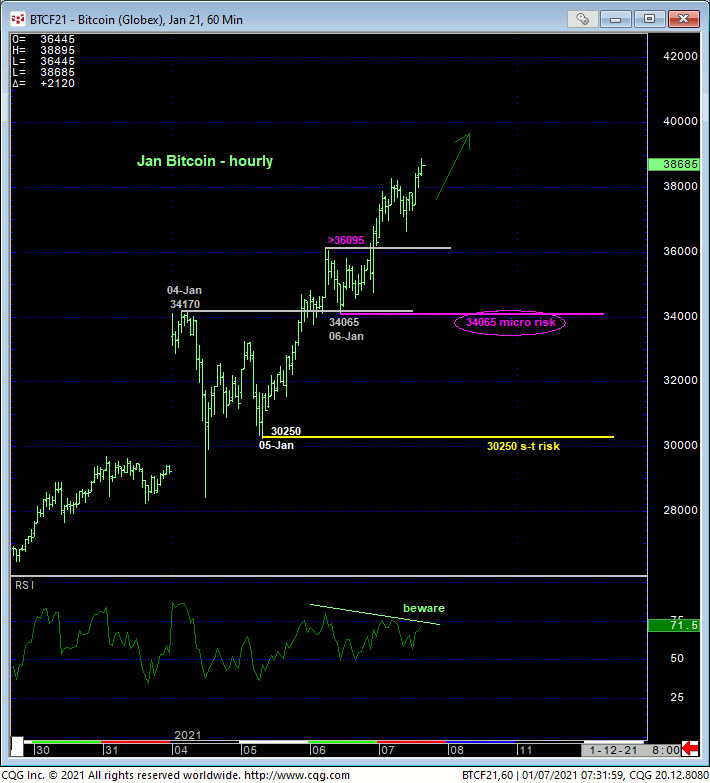
Drilling down even further to an hourly chart of the Jan contract below, this very short-term perspective shows yesterday’s 34065 low left in the wake of yesterday afternoon’s break above Tue night’s 36095 high. A failure below 34065 would confirm a bearish divergence in momentum ON THIS HOURLY SCALE, with the most important technical by-product being the market’s definition of a more reliable high and resistance from which non-bullish decisions like long-covers can only then be objectively based and managed.
OF COURSE, we would not be able to conclude anything more than another interim corrective hiccup from such a minor momentum failure. But at least the market would have rejected/defined an objective high and risk parameter the market would then have to recoup to negate a peak/reversal threat, chalk the setback up as a correction and reinstate the secular bull. For longer-term institutional players, such an admittedly short-term mo failure gives them the objective opportunity to exchange whipsaw risk (back above whatever high is left in the wake of a mo failure below 34065) for much, much deeper nominal risk below even 30250, let alone 20360.
These issues considered, a bullish policy remains advised with a failure below 34065 required to defer or threaten this call enough to warrant paring or neutralizing exposure commensurate with one’s personal risk profile. The next pertinent and objective risk parameter below 34065 is 30250. In lieu of weakness below at least 34065, the trend is up on all scales and should not surprise by its continuance or acceleration.
