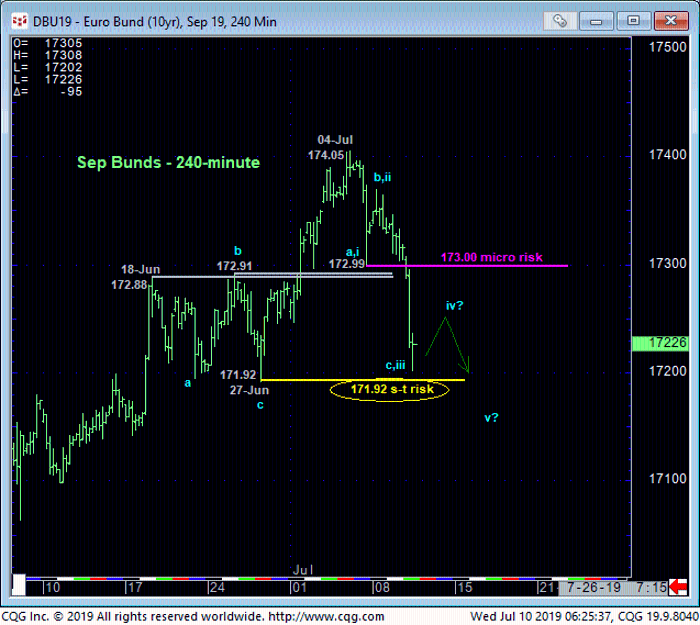
Just four trading sessions ago this market posted its highest price in history after reaffirming the nearly 30-year secular bull trend with last month’s break above Jun’16’s 168.86 high. While the developing potential for a bearish divergence has resulted from 2016-18’s correction that interfered with the secular bull, this bull has been historically massive and will require an equally massive amount of “non-bullish behavior” to threaten it.
Everyone knows it’s only a matter of when, not if this bull will end. But on this secular scale there is NO technical evidence whatsoever to conclude that this nearly-30-year uptrend is anything but intact.
An interesting side note is this market’s penchant for holding Fibonacci retracements on corrections of preceding portions of the bull over the past 20 years as indicated in the quarterly log chart below.
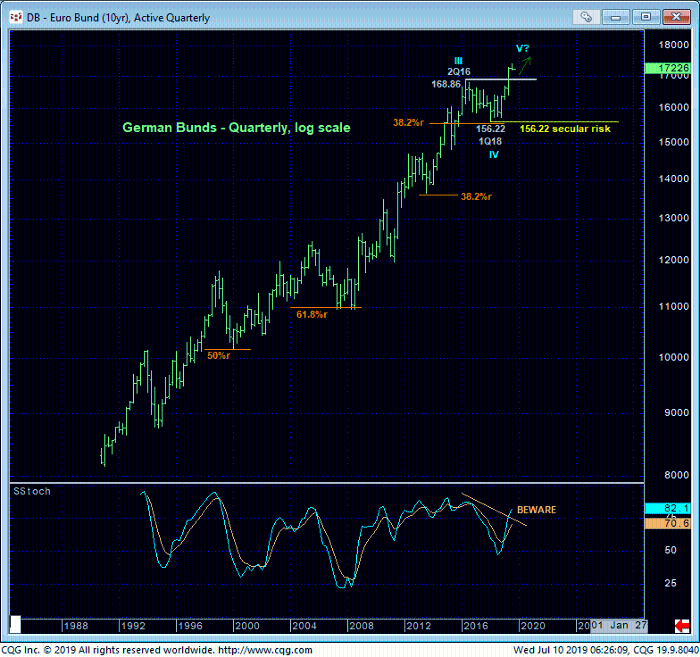
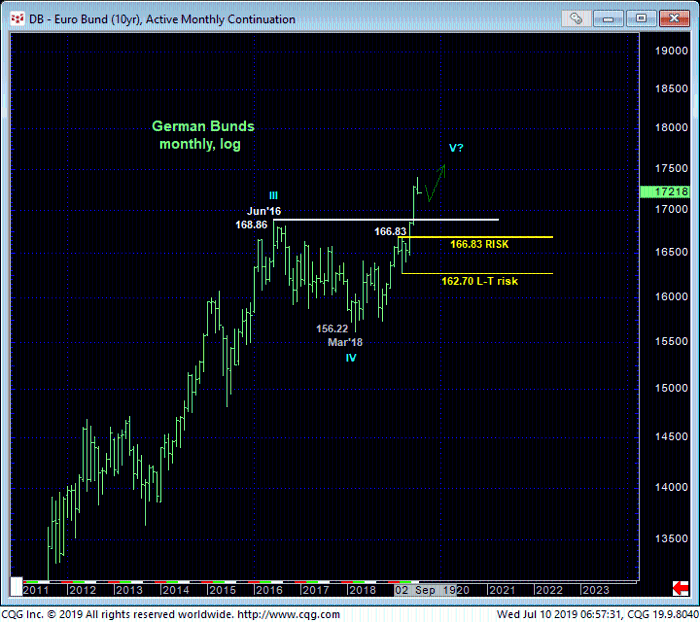
The monthly log chart above and weekly chart below show early-Jun’s resumption of the secular bull trend above Jun’16’s 168.86 high after a textbook 3-wave correction to Mar’18’s 156.22 low that held the exact (156.11) 61.8% retrace of Jun’15 – Jun’16’s preceding 148.23 – 168.86 rally. Former 168.86-to-166.83-area resistance from Jun’16 to Feb’19, since broken, serves as new support within the secular uptrend. A failure below Feb’s 166.83 high is MINIMNALLY required to suggest the secular bull market is in jeopardy. Setback attempts to anywhere near the 169-handle would be advised to first be approached as corrective buying opportunities for long-term players.
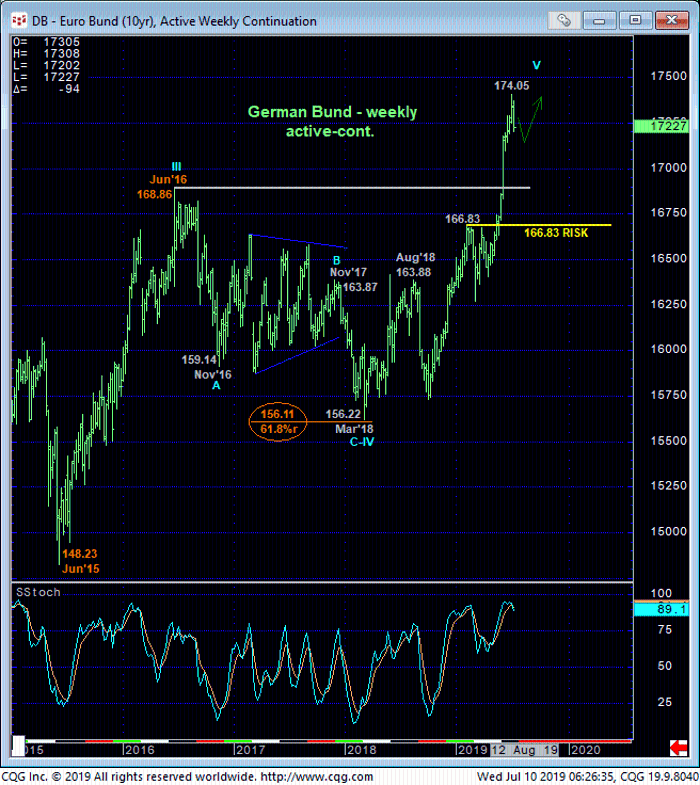
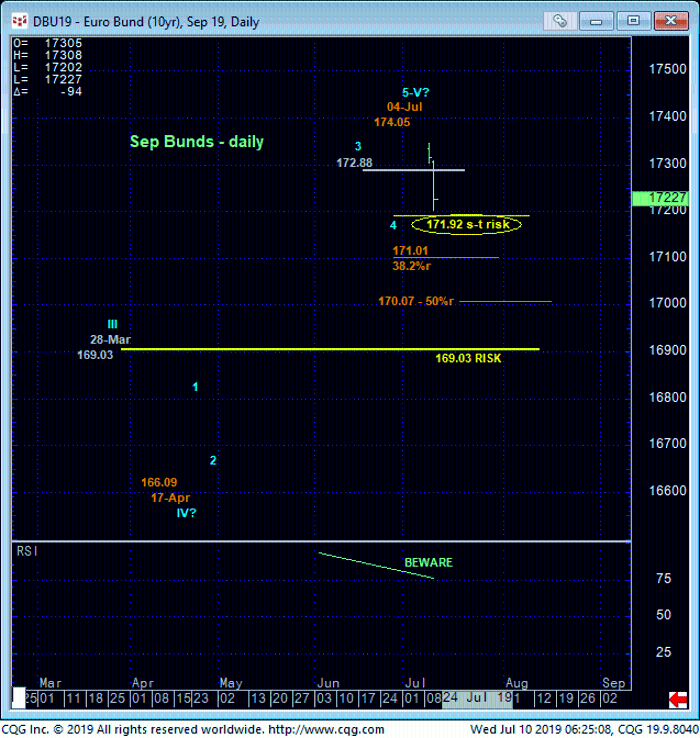
On a more practical daily scale above and 240-min chart below, we suspect that today’s sharp relapse has prompted a buzz with traders. It’s easy to see why when the market has done nothing but trend higher in a very orderly manner for the past three months. The developing POTENTIAL for a bearish divergence in daily momentum and prospect that 04-Jul’s 174.05 high completed a textbook 5-wave Elliott sequence from 17-Ars 166.09 low contributes to this peak/correction/reversal threat.
This threat/divergence potential will be considered CONFIRMED to the point on non-bullish action on a failure below 27-Jun’s 171.92 corrective low and our short-term risk parameter. But clearly, compared to the secular bull market discussed above, even a confirmed bearish divergence in daily mo is a piddly drop in the proverbial bucket that would not allow us to conclude anything more than another interim correction lower within the still-unfolding secular advance.
Nonetheless, such a sub-171.92 failure will confirm at least interim weakness and define 04-Jul’s 174.05 high as one of developing potential and a specific, reliable short-term risk parameter from which non-bullish decisions like long-covers and cautious bearish punts can be objectively based and managed by shorter-term traders with tighter risk profiles.
On an even smaller scale below, today’s break below 05-Jul’s 172.99 initial counter-trend low confirms the short-term trend as down and leaves that initial (suspected minor 1st-Wave) low in its wake as a micro risk parameter from which bearish punts can be objectively based and managed. A recovery above 173.00 without this market first breaking 171.92 would render this relapse from last week’s high a 3-wave and thus corrective affair consistent with the secular bull trend and long-term bullish policy.
Should the market break below 171.92, confirming the end of the rally from 17-Apr’s 166.09 low, the extent of that initial counter-trend decline is indeterminable. But given this market’s penchant for respecting Fibonacci retracements, we would be watchful for the requisite relapse-stemming bullish divergence in short-term mo around the 171.00 (38.2%r) or 170.00 (50%r) areas to stem the slide and expose at least a (b- or 2nd-wave) corrective rebuttal to this week’s slide if not a resumption of the secular bull.
These issues considered, a bullish policy remains advised with a failure below 171.92 required for shorter-term traders to move to the sidelines and for longer-term players to pare bullish exposure to more conservative levels in order to circumvent the depths unknown of a correction or reversal lower. Scalpers are OK to consider cautious bearish punts on a pop to 172.60 OB with a recovery above 173.00 negating this specific call and warranting its cover.
