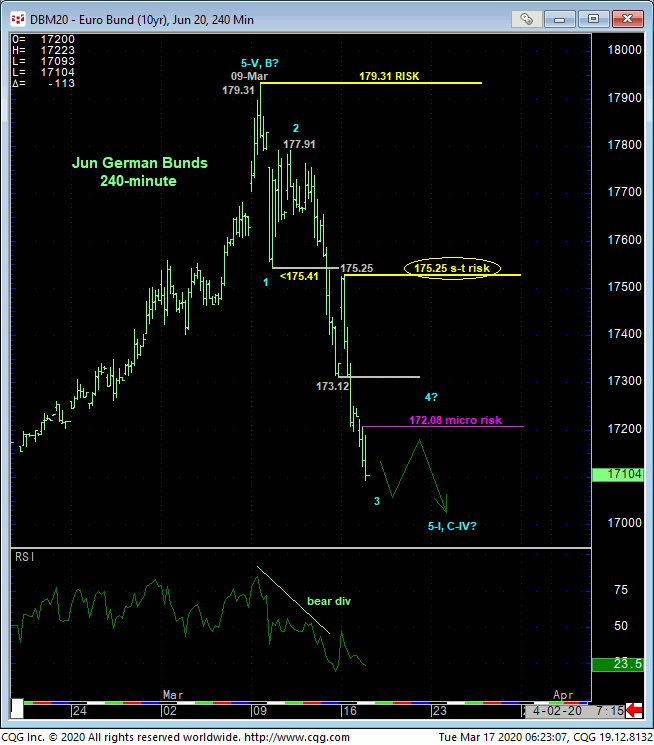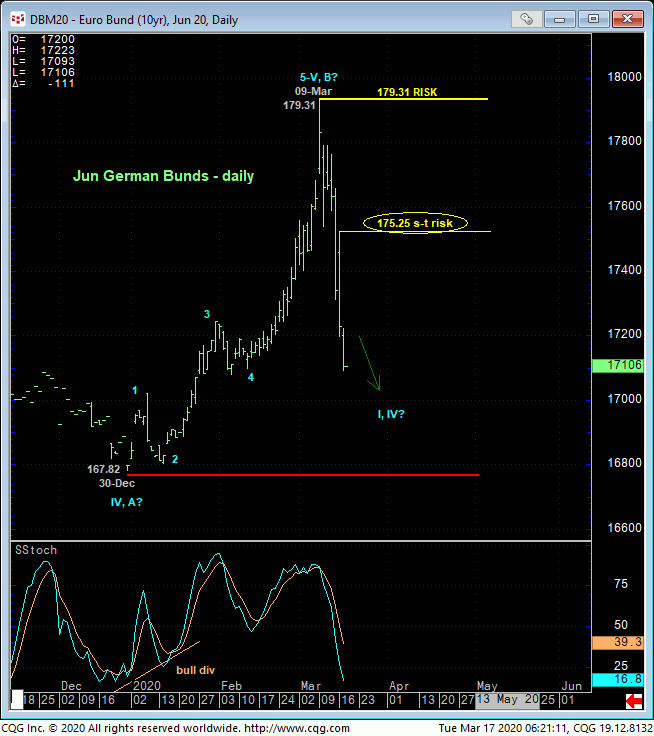
Yesterday morning’s break below Fri’s 173.12 low reaffirms our peak/reversal count discussed in Fri morning’s Technical Blog and leaves yesterday’s 175.25 high in its wake as the latest smaller-degree corrective high the market is now required to recover above to break the clear and present downtrend from 09-Mar’s 179.31 high. Given the magnitude of this move relative to the high volatility surrounding most markets these days, a “smaller-degree” risk level that’s four handles away seems impractical. But that’s the nature of the current beast and remains a fact.
Indiscernible on the 240-min chart below is a very minor corrective high from earlier today at 172.08 that, if recouped, would confirm a bullish a bullish divergence in momentum on an HOURLY scale. Such a micro mo failure would, in fact, reject/define some semblance of a low from which non-bearish decisions could be objectively based and managed. But from a scale perspective, that would only allow us to conclude the end of the portion of the downtrend from yesterday’s 175.25 high, NOT the broader downtrend from 179.31.
Attention to SCALE and adherence to personal risk profile is always important, and particularly so under recent volatile circumstances. Paring or neutralizing bearish exposure on a recovery above a corrective high and risk parameter like 172.08 is fine for very short-term traders as they exchange whipsaw risk for greater nominal risk. But one CANNOT conclude the end of the broader slide from 09-Mar’s 179.31 high from such a minor mo failure. This can only be conclude from a recovery above 175.25 currently OR following the definition of another interim corrective high and resumption of the bear that would provide a new smaller-degree corrective high and risk parameter.


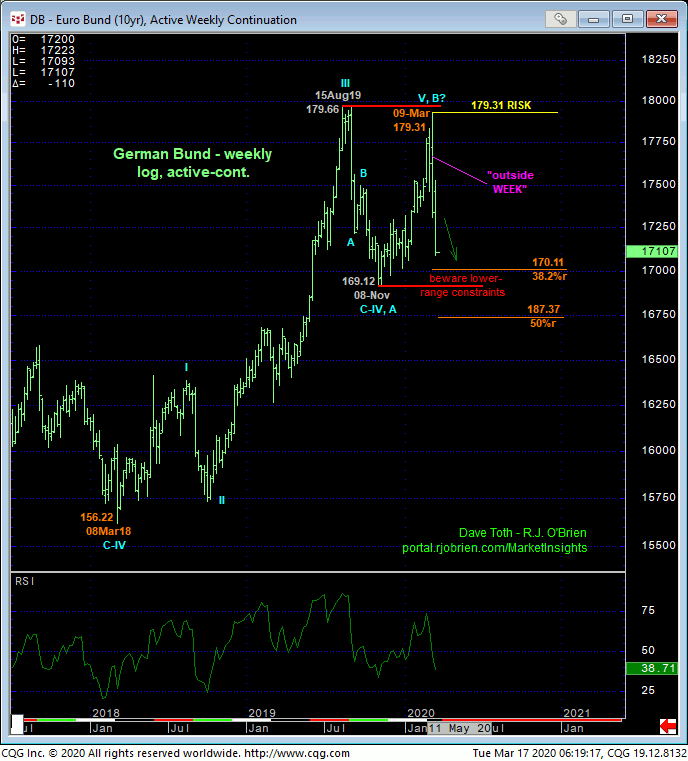
From a long-term perspective, it’s indeterminable at this point whether the current relapse is merely a (C-Wave) component of a major corrective/consolidative event from last Aug’s 179.66 high before a (5th-Wave) resumption of the secular bull to 180+ levels OR the initial (1st-Wave) phase of a peak/reversal environment that would be major in scope. The weekly log active-continuation chart below shows that the market has very quickly retraced nearly 38.2% of the entire TWO YEAR bull from Mar’18’s 156.22 low to this month’s 179.31 high.
This is enlightening when we consider that the stock markets of the world have yet to show evidence that their past month’s meltdowns have ended. Regardless however, this weekly chart shows the market’s encroachment on Nov’s obviously key 169.12 low and support, the break of which is required to, in fact, break the secular bull market and expose the new long-term trend as down. If there’s a time and place to be more keenly aware of a bullish divergence in momentum needed to stem or threaten the past week’s clear and present downtrend, it is in the days and perhaps week or two immediately ahead and from levels between spot and Nov’s 169.12 low. Herein lies the importance of corrective highs and risk parameters like 175.25 and even 172.08.
But even in the case of a major peak/reversal environment, we believe a (2nd-wave or right-shoulder) corrective rebuttal to the past week’s decline is highly likely in the months ahead. And if that recovery attempt stalls out with a bearish divergence in momentum after some 50% or 60% or 70% retracement, we believe the long-term risk/reward merits of a new bearish policy and exposure could be exceptional. Before we even come close to that opportunity however, the market’s got to stem the clear and present downtrend with a bullish divergence in momentum. And a recovery above at least 172.08 and preferably 175.25 is required to satisfy this requirement. Until and unless such strength is shown, further lateral-to-lower prices are anticipated in the days ahead.
In sum, Fri’s failure below 175.41 negated any reason to be bullish this market. “Down here” however, we believe the risk/reward merits of a bearish policy are questionable, so a neutral/sideline policy is advised for the time being. A very, very short-term bearish position/scalp is OK “down here” with a very tight stop above 172.08. Otherwise, we will be watchful for a bullish divergence in momentum in the week or so ahead to stem this slide and expose a favorable risk/reward trade from the bull side. In lieu of such a bullish divergence in momentum, further losses towards the 169-handle should not surprise.


