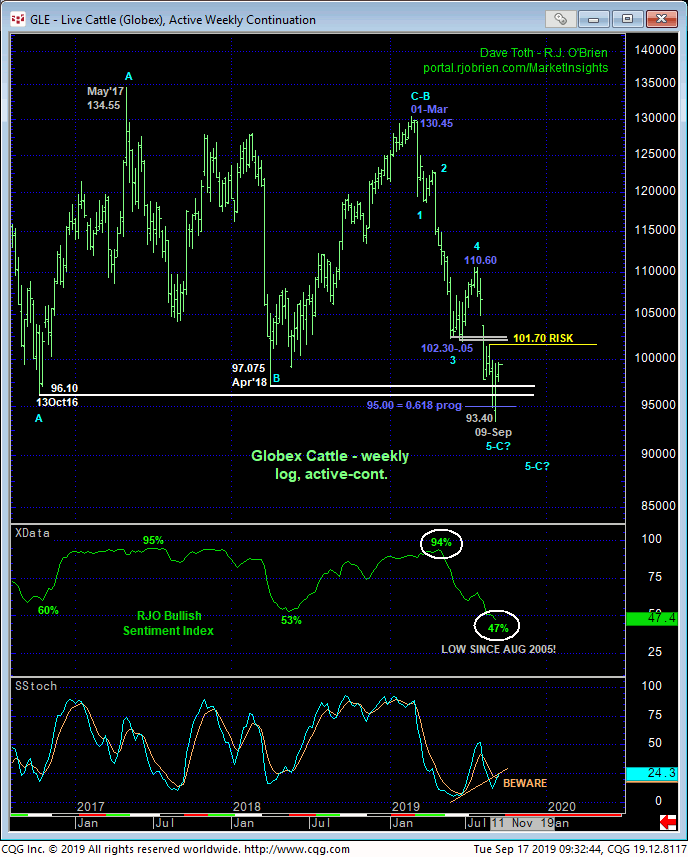
In last Wed’s Technical Blog we discussed that day’s recovery above our short-term risk parameter defined by 30-Aug’s 98.35 low as a “start” to a prospective base/reversal count that could be major in scope, acknowledging 26-Aug’s 101.675 larger-degree corrective high as the key risk parameter this market needed to recoup to confirm a bullish divergence in momentum of a scale sufficient to break the broader bear. The hourly chart below shows that our 101.70 long-term risk parameter remains intact, but today’s poke above last week’s 99.50 high reaffirms the intermediate-term uptrend that provides another incremental positive step towards that broader base/reversal count.
09-Se’s 93.40 low remains intact as one of developing importance and our short-term risk parameter from which non-bearish decisions can be objectively based and managed by both short- and longer-term traders. Today’s 97.625 low left in the wake of today’s pop above 99.50 may be used by scalpers as a micro risk parameter from which to base bullish punts. This risk level may come in handy if the market continues t respect late-Aug’s 101.675 high as resistance.
The daily chart below shows the market’s failure thus far to sustain early-Sep losses below former 97.975-area support-turned-resistance. This is “an” indication of strength, but it’s not THE indication of strength above our 101.70 key risk parameter the market remains obligated to recoup to, in fact, break the downtrend from 29-Jul’s 110.60 high. However, the prospect that the entire 110.60 – 93.40 decline is a complete a complete (textbook, actually) 5-wave Elliott sequence is clear, with the completing 5th-Wave down from 101.675 being only a few ticks beyond the (93.75) 0.618 progression of the net distance of Waves-1-thru-3 from 110.60 to 97.975.
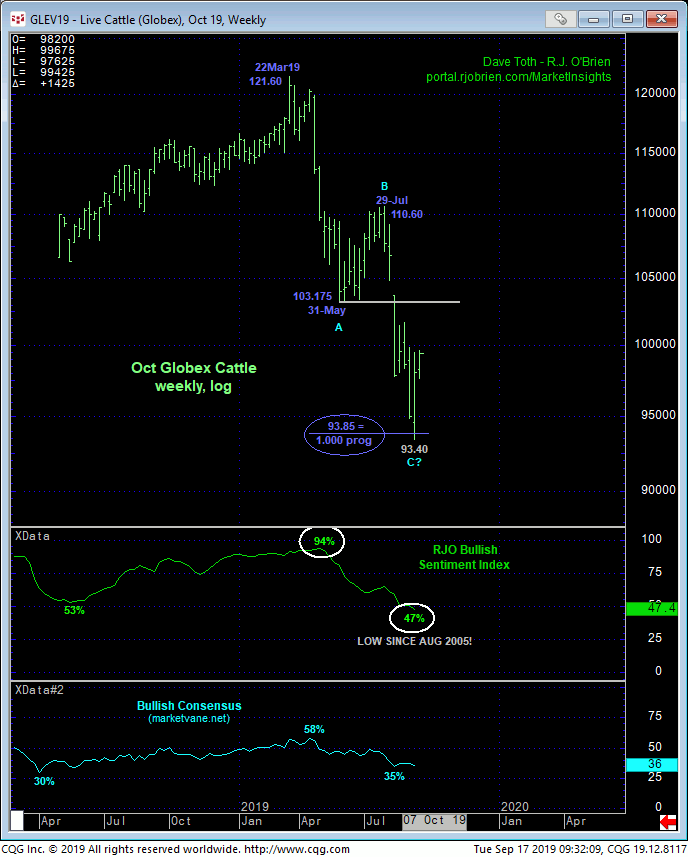
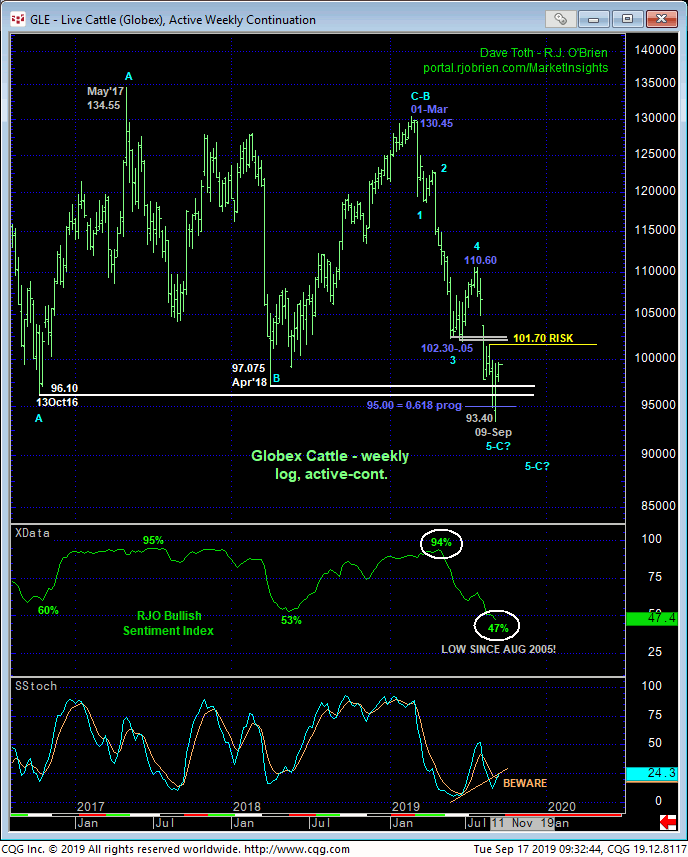
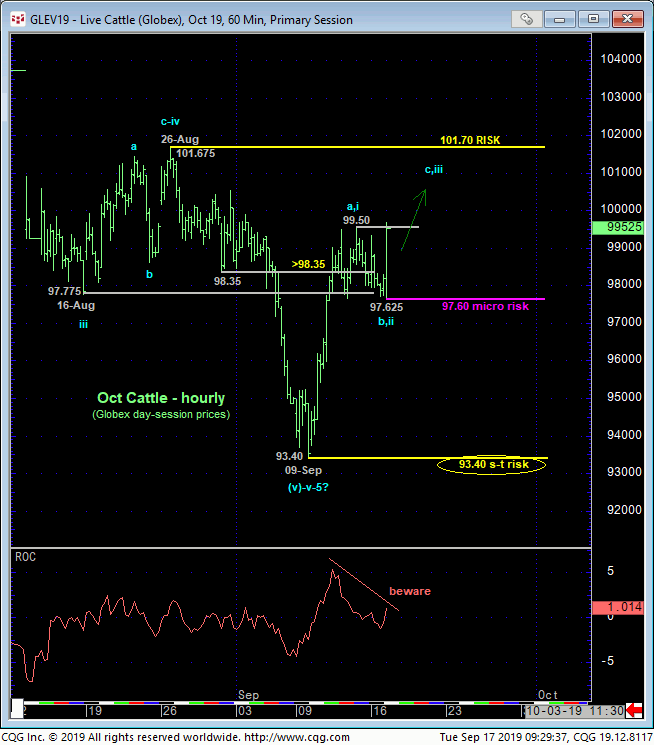
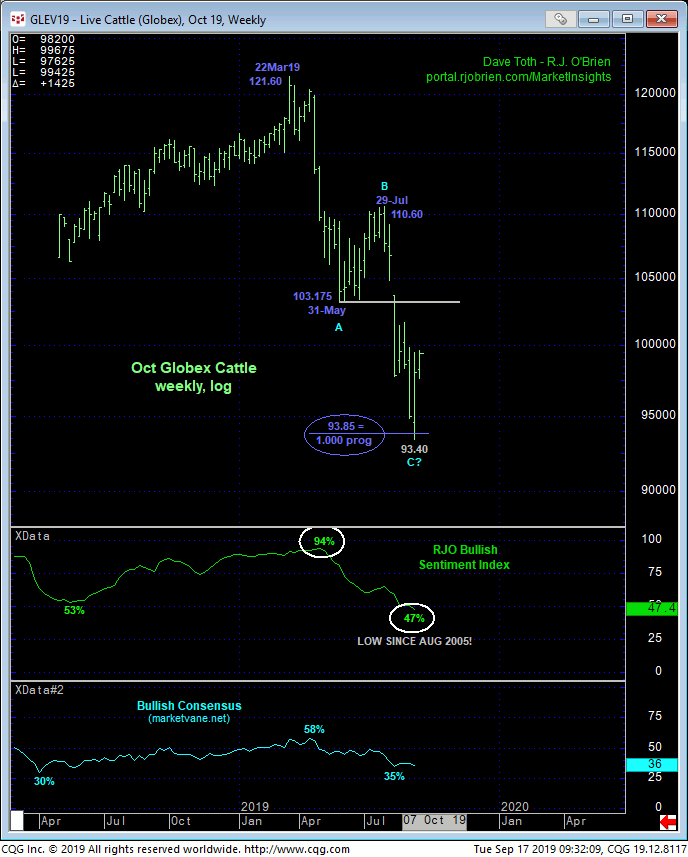
Contributing mightily to a major base/reversal environment are facts shown in the weekly log active-continuation chart above and weekly log chart of the Oct contract below. These facts include:
- an arguably complete 5-wave sequence down from 01-Mar’s 130.45 high in the continuation chart above
- the market’s gross failure thus far to sustain losses below the past THREE YEARS’ key support-turned-resistance around the 96-handle
- the Fibonacci fact that the decline from 29-Jul’s 110.60 high in the Oct contract is virtually identical in length (i.e. 1.000 progression) to Mar-May’s preceding 121.60 – 103.175 decline
- waning downside momentum and
- historically bearish levels in our RJO Bullish Sentiment Index of the hot Managed Money positions reportable to the CFTC.
Indeed, the current 47% reading in our RJO BSI is the greatest extent to which the huddled mass Managed Money contingent has had its neck sticking out on the bear side since Aug 2005! As we’ve experienced for weeks, such pessimism is of no technical matter as long as the downtrend sustains itself. But once that trend becomes compromised, sentiment/contrary opinion becomes an applicable and very helpful indicator that warns of upside vulnerability. Again, commensurately larger-degree proof of strength above 101.70 remains required to, in fact, break the broader downtrend and contribute to a base/reversal count that could be major in scope. But the facts and factors listed above are a good starting point.
Finally, the monthly log chart below shows the market’s inability to sustain early-Sep’s break below a hugely significant 96.10-area and condition, where the bear had every opportunity to kick some cowbell and take names. But it didn’t. And against this unique and compelling list of base/reversal factors, traders are advised to beware of a base/reversal count that could be major in scope and will be ignited, in our opinion, on proof of strength above 101.70.
These issues considered, shorter-term traders have been advised to move to a cautiously bullish stance with weakness below 97.60 and/or 93.40 (depending on one’s personal risk profile) required to defer or negate a bullish count and warrant its cover. Long-term players remain OK to maintain a cautious bearish policy with a recovery above 101.70 required to reverse into a new bullish policy and exposure with subsequent weakness below 93.40 then required to negate that new bullish initiative. Given the magnitude of Mar-Sep’s meltdown and the base/reversal factors lining up, these are indeed opportunistic times and prices.
