DEC CORN
In 30-Jun’s Technical Blog following the market’s obliteration of both our short- and longer-term risk parameters at 3.40 and 3.49 that exposes a base/reversal environment we believe may be major in scope, we discussed the relative ease of knowing precisely where to cover previous bearish policies and exposure. It’s also not hard to define 26-Jun’s 3.22 low as, quite obviously, one of developing importance and a new long-term risk parameter from which long-term players can base and manage non-bearish decisions like short-covers and new bullish punts. The short-to-intermediate-term challenge pertinent to shorter-term traders is identifying a preferred and practical risk/reward area and condition from which to establish a new bullish policy.
When trying to navigate a reversal-threat environment, we like to refer to our three reversal requirements:
- a confirmed bullish divergence in momentum (satisfied)
- proof of trendy, 5-wave impulsive, behavior up (satisfied)
- proof of labored, 3-wave corrective behavior on a subsequent relapse attempt (NOT satisfied)
Typically, following such a protracted downtrend like Jun’19 – Apr’20’s decline, and especially when the first counter-trend move is as violent and obvious as last week’s rally was, market’s will provide a corrective rebuttal lower within the broader base/reversal PROCESS. In order to stem the initial counter-trend rally and reject/define a more reliable high from which to objective navigate the corrective relapse, the market must stem the rally with a confirmed bearish divergence in momentum. This requires a relapse below a prior corrective low or an initial counter-trend low.
The hourly chart of Globex day-session prices below does not yet reflect today’s prices, but overnight prices are showing the market trading around 3.58. On the heels of Thur’s dip to 3.52-3/4, we can objectively identify that 3.52 level as one the market now needs to sustain gains above to maintain late-Jun/early-Jul’s initial counter-trend rally. Its failure to do so will arguably break the initial counter-trend rally and expose the short-term-intermediate-term trend as down, leaving Wed’s 3.63 high in its wake as the end of the initial (A- or 1st-Wave) high of a major base/reversal process and start of a (B-0 or 2nd-Wave) correction lower. Until that 3.52 level is broken, further gains should not surprise.
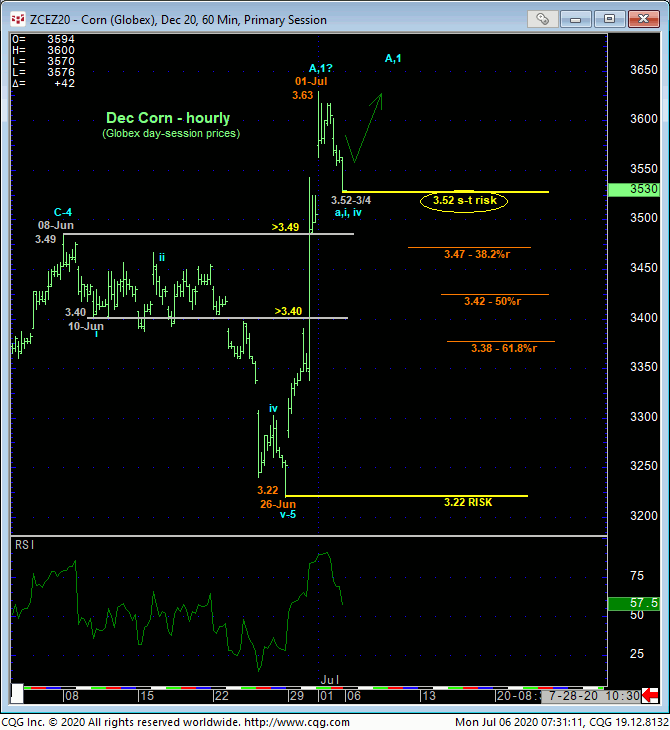
Reinforcing the prospect that the initial A- or 1st-Wave rally may have ended with last week’s 3.63 high is the fact that that level is the exact 50% retrace of Jan-Jun decline from 4.05 to 3.22 in the Dec contract. Given that this Fibonacci relationship is a “derived” one however, we require a confirmed momentum failure to lend it the credence needed to rely on the rejected high (3.63) as an objective risk parameter. A failure below 3.52 will satisfy this requirement.
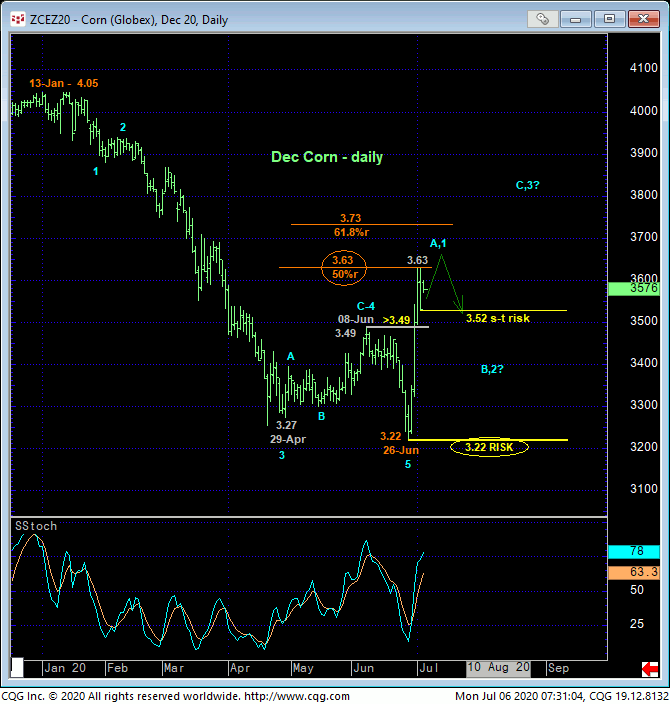
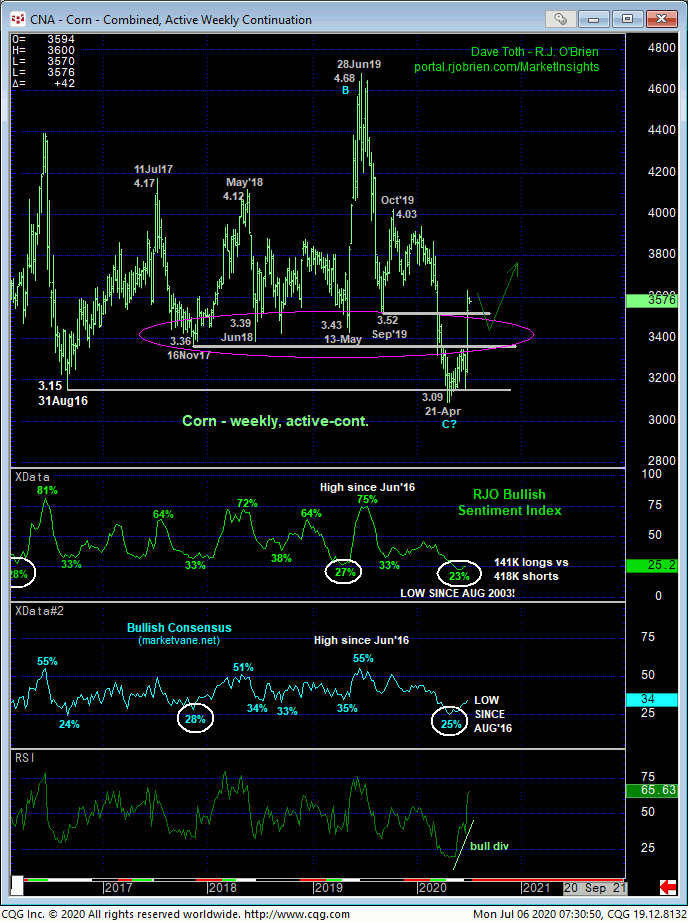
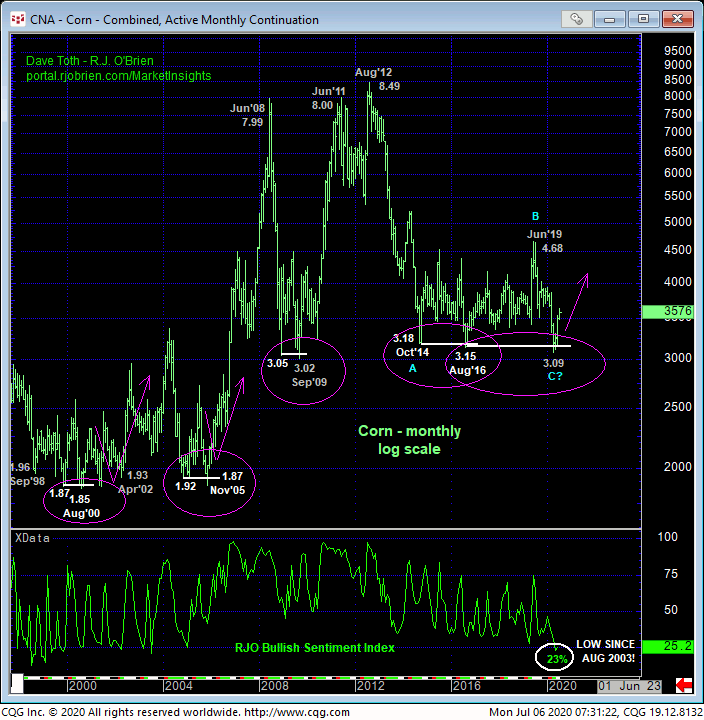
The long-term factors that contribute to a major base/reversal-threat environment are clear in the weekly (above) and monthly (below) charts following last week’s bullish divergence in momentum on a WEEKLY scale:
- historically bearish sentiment not seen since at least Aug’16 and, in the case of our RJO Bullish Sentiment Index of the hot Managed Money positions reportable to the CFTC, since 2003!!!
- the market’s failure to sustain losses below Apr/May losses below a historical ton of former support from the 3.50-to-3.35-area that should have held as new resistance if the market was truly weak “down there”
- the market’s history of severely testing or breaking prior key lows and support by a mere few cents within broader base/reversals shown in the monthly chart below.
These are technical facts that once again warn of a major base/reversal environment similar to that that followed the 1998/2000 slowdown process and eventually led to 2006’s price explosion. Will 2020 be THAT kind of year? Or will this year be another year where this market “just” another $1.00 or $1.50 intra-six-year=-lateral-range spasm similar to 2014-15, first-half-2016, Aug’16 – Jul’17, Nov’17 – May’18 and May-Jun’19? The extent and during of the suspected reversal higher from 26-Jun’s 3.22 low is anyone’s guess. But because of the facts listed above, and especially historically-skewed bearish sentiment typical of all major base/reversal environments, we believe the market’s upside potential in the weeks and months ahead will be extreme. We also know that the bear needs to break 3.22 precisely to negate this call. In the meantime, traders are advised to first approach a suspected rebuttal lower in the period ahead as a corrective buying opportunity. As the market retraces however, perhaps 50% (to 3.42ish) or more, a relapse-stemming bullish divergence in momentum will be required to reject/define a specific low and support from which the risk/reward merits of a bullish policy and exposure may be extraordinary.
DEC SOYBEAN MEAL
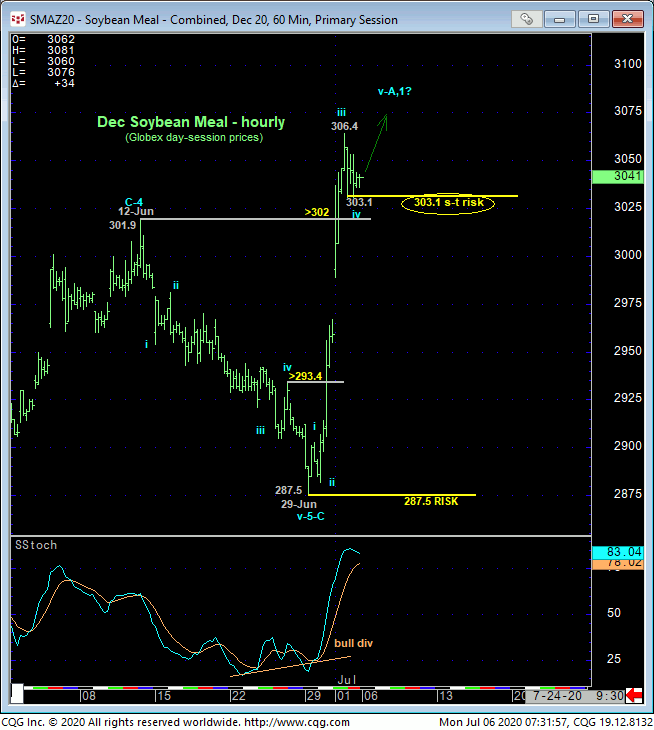
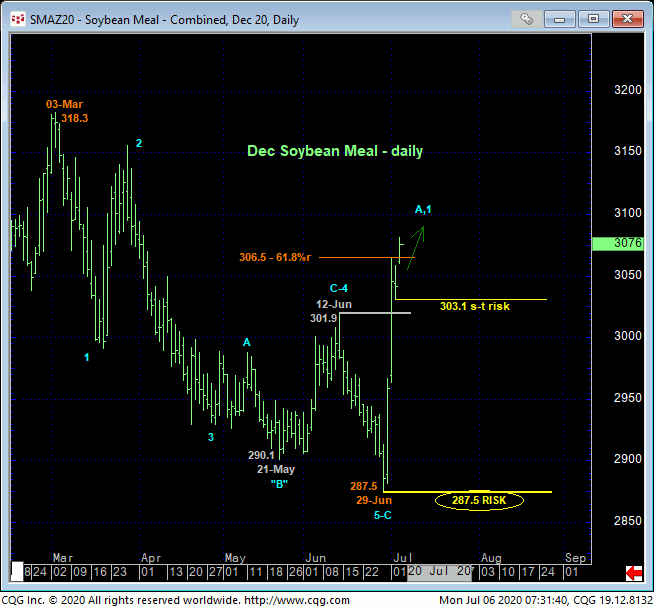
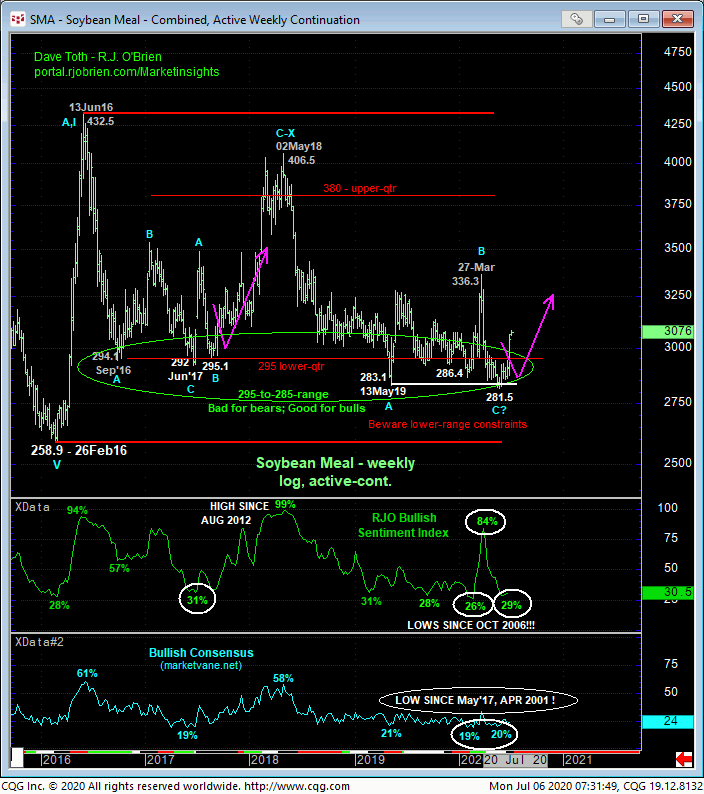
The technical construct and expectations of the meal market are identical to those detailed above in corn with our key short- and long-term risk parameters identified at 303.1 and 287.5. We will be watchful for and require a short-term mop failure below 303.1 to arrest the initial counter-trend reversal and expose a corrective rebuttal lower that will first be approached as a buying opportunity. In lieu of at least sub-303.1 levels, the trend is up on all practical scales and should not surprise by its continuance.
