DEC CORN
Yesterday/today’s clear break below the past couple weeks’ 3.69-to-3.64-area support obviously reaffirms the developing downtrend and leaves 29-Aug’s 3.77 high in its wake as the latest smaller-degree corrective high this market is now minimally required to recover above to threaten a continued bearish policy and exposure. Per such this 3.77 level becomes our new short-term risk parameter from which traders can objectively rebase and manage the risk of a still-advised bearish policy and exposure.
Former 3.64-to-3.69-area support would be expected to hold as new resistance per any broader bearish count.
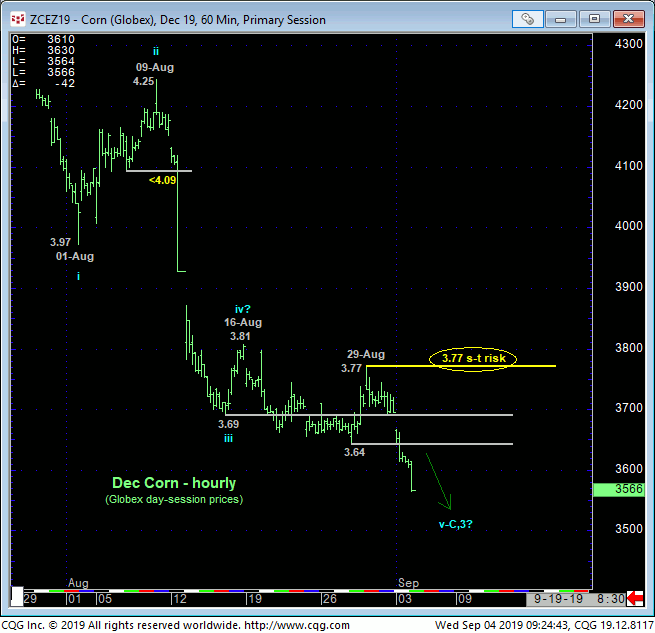
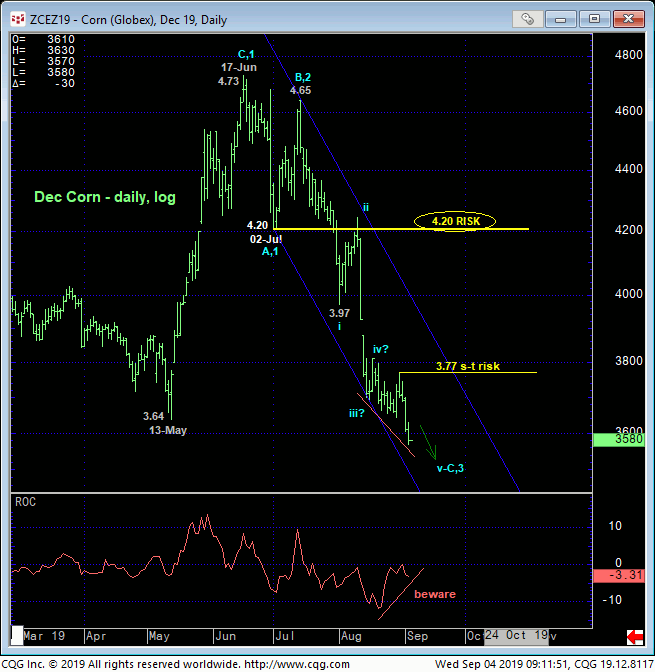
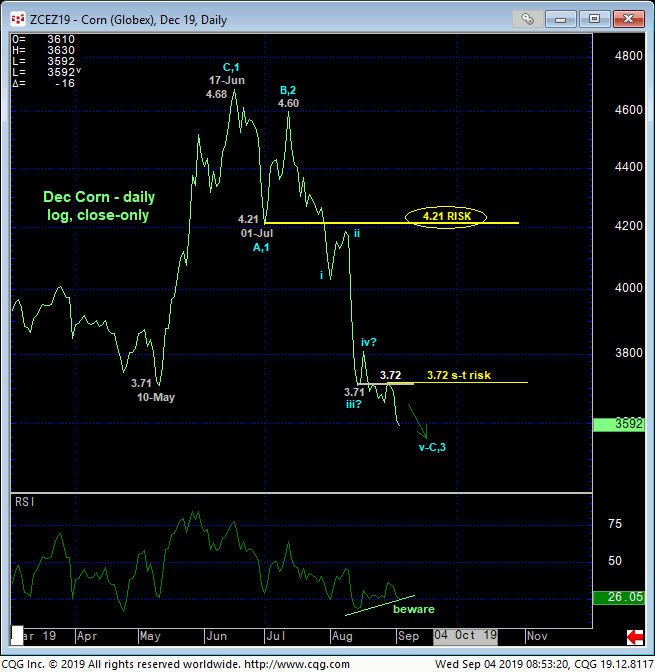
The developing POTENTIAL for a bullish divergence in momentum is clear in both the daily bar chart above and daily close-only chart below. But only PROOF of strength above 29-Aug’s 3.77 intra-day corrective high or a close above 28-Aug’s 3.72 corrective high close will CONFIRM the divergence to the point of non-bearish action. Until and unless such specific strength is shown, the trend remains down and should not surprise by its continuance.
IF/when such a mo failure is confirmed, relative to the magnitude of Jul-Sep’s portion of the downtrend, such a mo failure would be of an insufficient scale to conclude a broader reversal higher. But for some longer-term reasons we’ll discuss below, even a bullish divergence in admittedly shorter-term mo would not be able to be ignored as the start of a more protracted reversal higher.
Indeed, in 09-May’s Technical Blog just two trading days before 13-May’s major low and sharp reversal, we discussed a virtually identical technical construct to the current one and identified a specific risk level at 3.71 in the then-prompt Jul contract that the bear needed to sustain losses below to maintain a broader bearish count. Four trading days later that 3.71 corrective high was history and the market exploded higher.
There’s no way to tell what looms above last week’s similarly important 3.77 corrective high and our new short-term risk parameter. But what we will know as fact if the market recoups 3.77+ levels is a specific, rejected/defined low that COULD be the END of the decline from 17-Jun’s 4.73 high and start of another protracted move higher. We can only cross that base/reversal-threat bridge f/when the market takes us there, and we believe that will start with a recovery above 3.77. Until and unless such strewngth is shown, further lateral-to-lower prices remain expected.
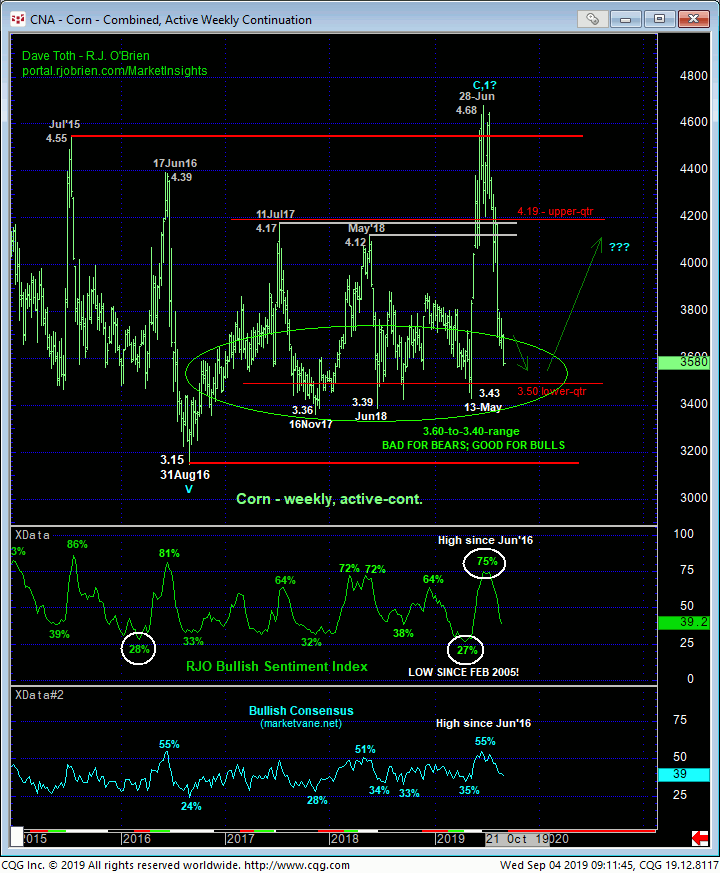
Downside MOMENTUM is critical “down here” as the market engages what we believe to be a pivotal around the 3.60-to-3.40-range that has repelled EVERY assault over the past two years in what we still maintain is a major, multiyear BASE/reversal process. This 3.60-to-3.40-range and lower-quarter of what is now a 5-YEAR lateral range has been an outstanding risk/reward area and condition from which producers were afforded the opportunity to pare and then neutralize bear hedges and end-users were afforded the opportunity to initiate bull hedges. Such opportunities may be afforded once again in the weeks and perhaps even days ahead.
If we’re wrong on this major base/reversal count and the past month’s collapse is a component of the resumption of the secular bear trend, all the market needs to do is SUSTAIN TRENDY, IMPULSIVE BEHAVIOR DOWN THROUGH NOV’17’S 3.36 LOW AND SUBSEQUENTLY AUG’16’S 3.15 LOW. This is the exact same requirement and discipline we’ve discussed back in Apr/May, Jun’18 and Oct/Nov’17. The market failed to satisfy this requirement every time.
A recovery above last week’s 3.77 corrective high and risk parameter will provide the first indication that history is repeating itself once again, warranting at least pared bearish exposure if not a new bullish policy.
Another key factor detailed in the weekly log chart below are the sentiment/contrary opinion indicators we scrutinize heavily. The Bullish Consensus (marketvanbe.net) and our proprietary RJO Bullish Sentiment Index of the hot Managed Money positions reportable to the CFTC show the huddled masses virtually always most bullish right at major market peaks and most bearish at major market bottoms. Historically bearish sentiment helped us easily navigate mid-May’s base and reversal as well as late-Jun’s peak/reversal. And we strongly suspect that it will be a major contributor to this market next major bottom and reversal higher, whether that’s from sub-3.00 levels or next week from the current 3.60-to-3.40-range mentioned above as pivotal.
The current relapse hasn’t produced 14-year lows in the RJO BSI like that that existed during late-Apr/early-May’s base/reversal-threat period, but both of these indicators have eroded enough to warn of major upside vulnerability if/when this market recovers above 3.77, warranting at least a neutral, if not bullish policy.
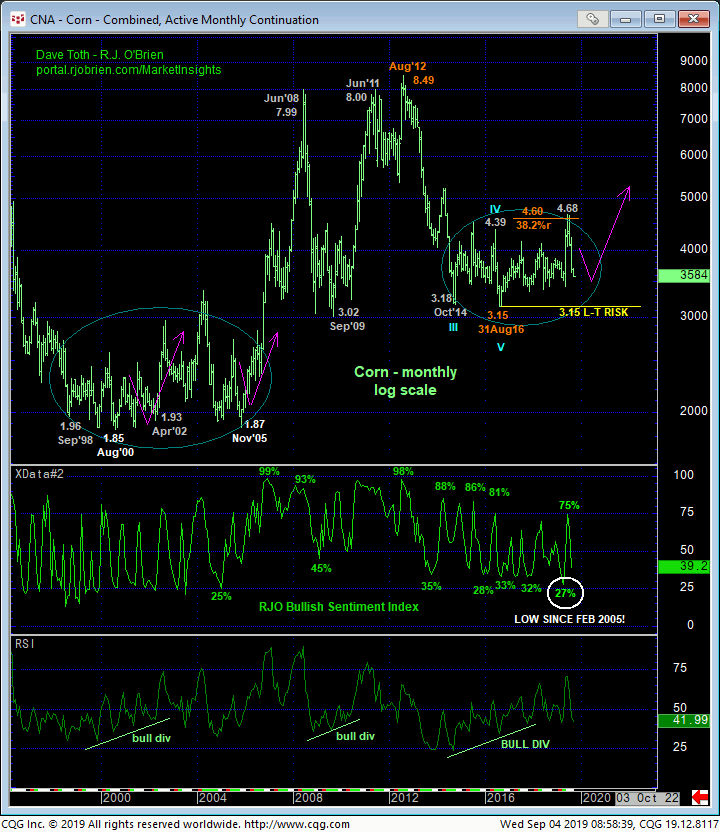
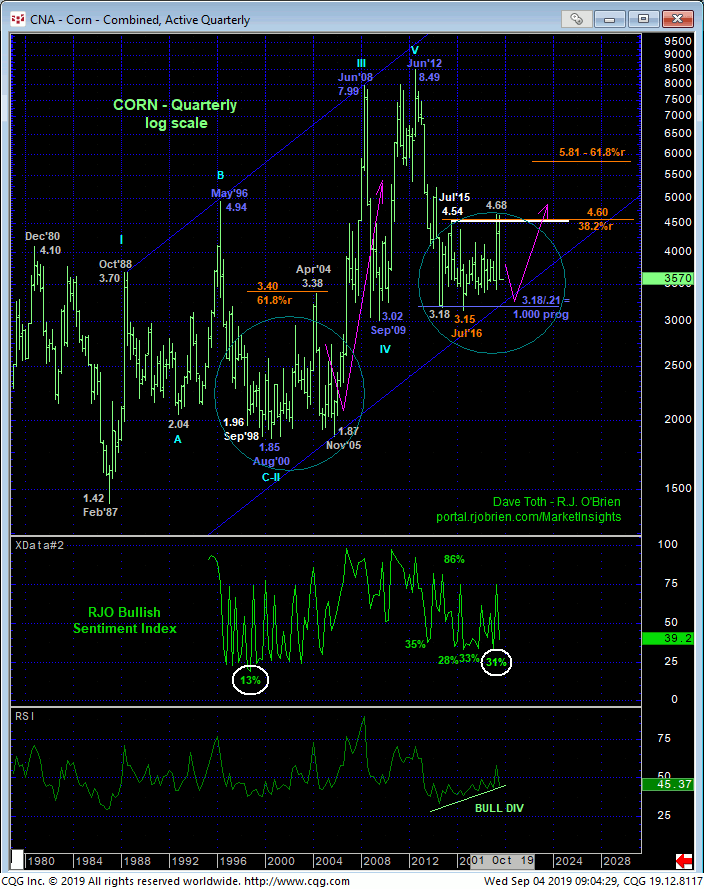
Finally and from an even more historic perspective, we point out once again in the monthly log chart above and quarterly log chart below the striking similarity of the past 5-year base/reversal-threat price action from Oct’14’s 3.18 low to that that followed Sep 198’s 1.96 low. Along with the still-incredible Fibonacci fact that the bear market from Jun’12’s 8.49 all-time high has spanned an identical length (i.e. 1.000 progression) to BOTH Jun’08- Sep’09’s corrective meltdown and May 196 – Aug 2000’s bear market, this merely lateral price action the past five years forms the basis for our long-term base/reversal count.
Notable within that 1998 – 2005-period is how often and how extensively CORRECTIVE relapses tested prior lows and support, sometimes coming with a few pennies of taking out major lows and resuming the secular bear before exploding back to the upside. Such failed attempts at breaking or sustaining levels below at least Nov’17’s 3.36 low, let alone Aug’s 3.15 low will reinforce this long-term base/reversal process once again and leave the market vulnerable to potentially significant gains like we’ve seen repeatedly over the past three years. And again, we will initially gauge/navigate such a base/reversal count on a smaller-degree with a recovery above 3.77.
Of course, commensurately larger-degree strength above 02-Jul’s 4.20 (A- or 1st-Wave) initial counter-trend low and long-term risk parameter is required to confirm another major reversal higher, but again, a recovery above the more practical 3.77 high and short-term risk parameter would provide the first indication of subsequent gains. Until such 3.77+ strength is confirmed however, further lateral-to-lower prices remain expected.
DEC SOYBEAN MEAL
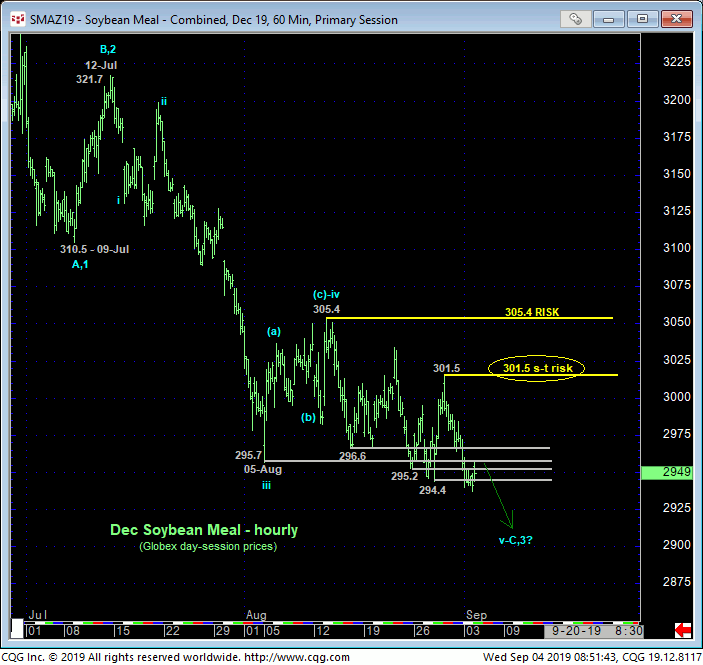
On all scales the technical construct of the bean meal market s identical to that detailed above in corn with recent smaller- and larger-degree corrective highs at 301.5 and 305.4, respectively, considered our new short- and longer-term risk parameters from which a still-advised bearish policy and exposure can be objectively rebased and managed. Former 294.4-to-295.7-area support is expected to provide new near-term resistance per any broader bearish count.
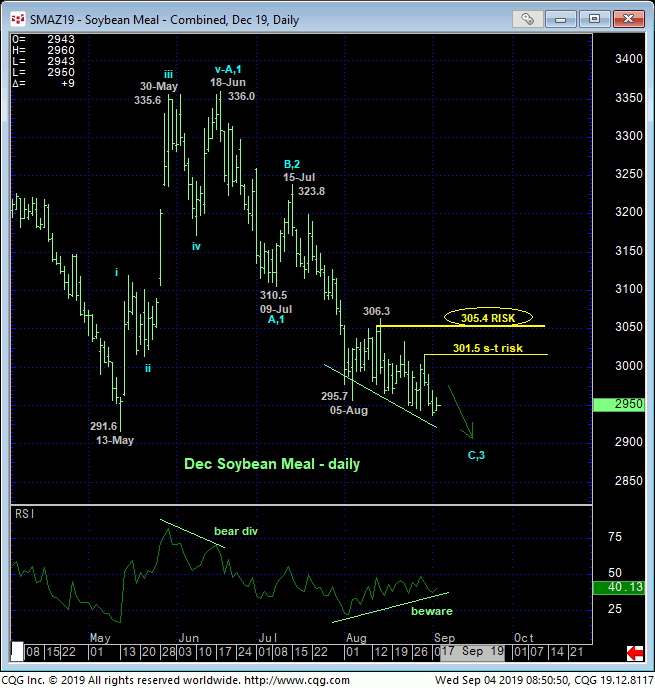
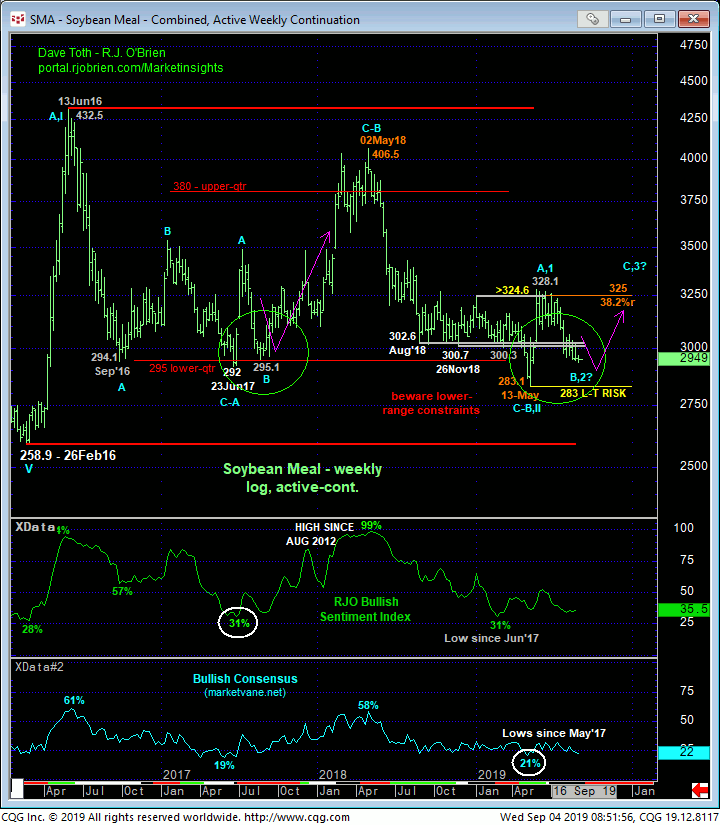
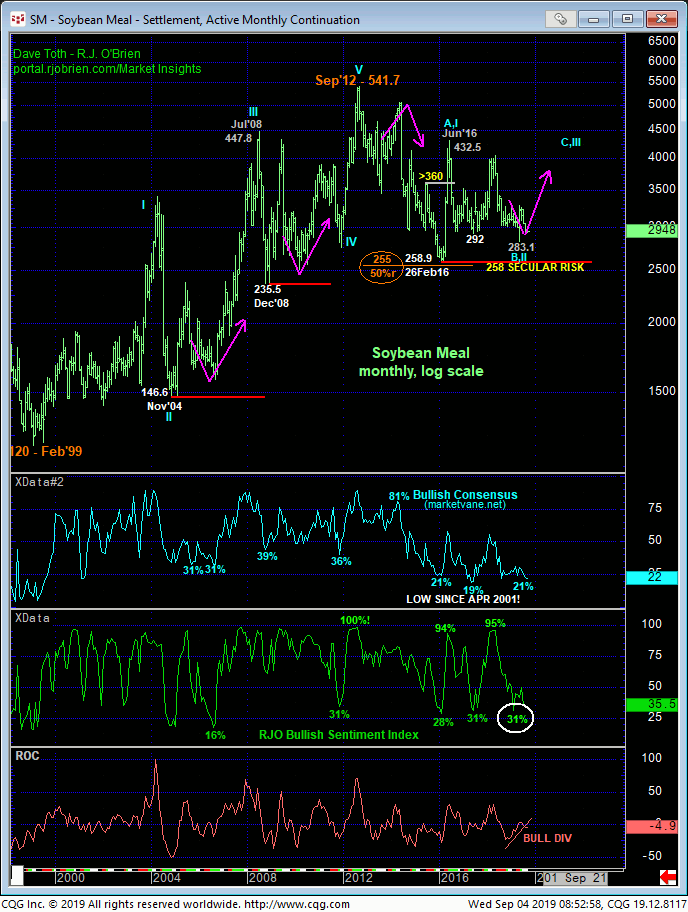
Here too from a long-term perspective, relapses shy of at least 13-May’s 283 low are advised to first be approached as corrective buying opportunities for long-term players as the past four months’ price action is virtually identical to Jun-Aug’17’s base/reversal action circled in green in the weekly log chart above. With market sentiment/contrary opinion levels still wafting around historically bearish levels, it is incumbent on the bear to sustain trendy, impulsive behavior down below at least 283 , if not Feb’16’s 258 low to maintain a bearish count. “Non-weakness” above 301.5 and certainly 305.4 would be initial price action Inconsistent with any broader bearish count and reinforcing of our broader base/reversal count.
These issues considered, a bearish policy and exposure remain advised with a recovery above 301.5 required for shorter-term traders to move to the sidelines and subsequent strength above 305.4 for longer-term players to move to at least a neutral stance to circumvent the heights unknown of a correction or reversal higher. In lieu of such strength further lateral-to-lower prices remain expected. But bears should tread cautiously “down here”.
