We know that trends typically slow down before they reverse, relegating MOMENTUM as the preeminent technical tool used to navigate the end of a trend. Specifically, a confirmed bearish divergence in momentum of a scale sufficient to threaten the major bull (in this case) trend. And this, quite simply, requires a failure below a prior corrective low or an initial counter-trend low needed to reject/define a more reliable high and resistance from which non-bullish decisions like long-covers, bearish punts and bear hedges can only then be objectively based and managed.
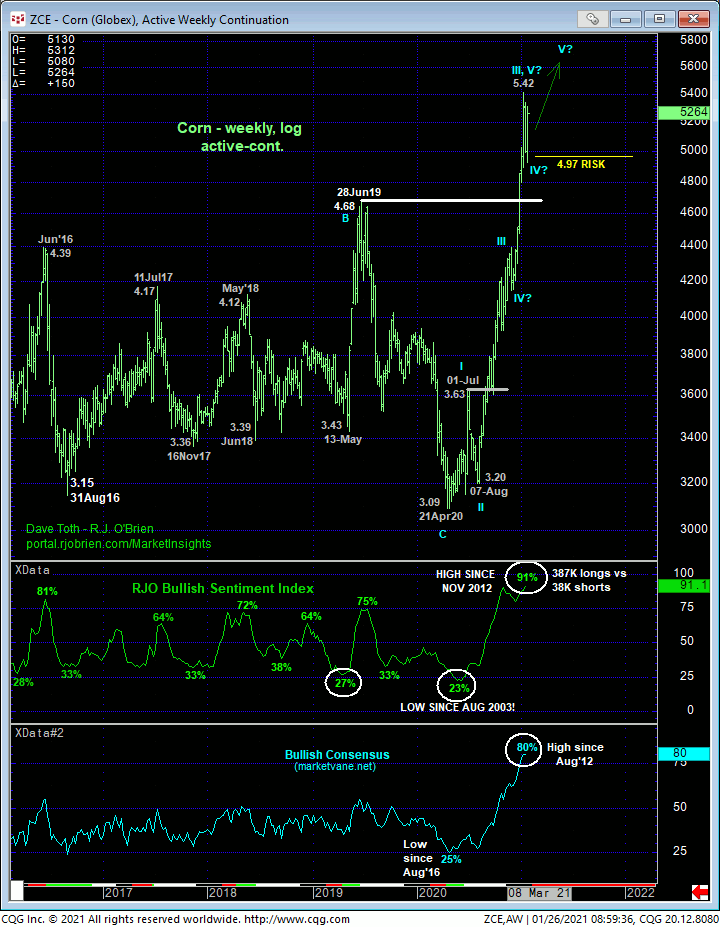
In 21-Jan’s Technical Blog, we discussed a bearish divergence in momentum, but of such a minor scale that nothing more than an interim corrective dip could be forecast as a result. Indeed, on a major scale sufficient to even defer, let alone threaten the secular bull trend shown in the weekly log chart below, the market has yet to provide the momentum failure evidence to threaten or break the major bull. As detailed below however, we are trailing our longer-term bull risk parameter to yesterday’s 4.97 Globex day-session low, the break of which will confirm AT LEAST a larger-degree correction. But given the extraordinary heights recently achieved in a steep, uninterrupted manner that has generated understandably historically sentiment/contrary opinion froth not seen since 2012’s infamous peak and reversal, shorter-term traders and even longer-term commercial players are advised to err on the side of a more conservative approach to risk assumption “up here”.
The age-old market trading adage,”Better bein’ out, wishin’ you were in, than in, wishin; you were out”, applies here where longer-term players acknowledge and accept whipsaw risk (back above 14-Jan’s 5.37 minor high) in exchange for much deeper nominal risk below 4.97. If the market fails below 4.97, it would be indeterminable whether that break is part of a larger-degree bull market correction OR a massive, relentless reversal lower. By side-stepping bullish exposure below 4.97, traders are then in the driver’s seat of waiting for the bull to arrest the break with a confirmed bullish divergence in momentum. Until and unless such a mo failure stems the slide, the market’s downside potential is indeterminable and potentially severe. Such a sub-4.97 break would also provide producers an acute level and condition from which to initiate bear hedges, willing to cover these hedges on resumed roof of the bull above 5.37. Narrowing pivotal flexion points to just a 40-cents range of 4.97-to-5.37 is about as acute and practical as we can get for a market that has just skyrocketed an uninterrupted $2.20-cents over five months.
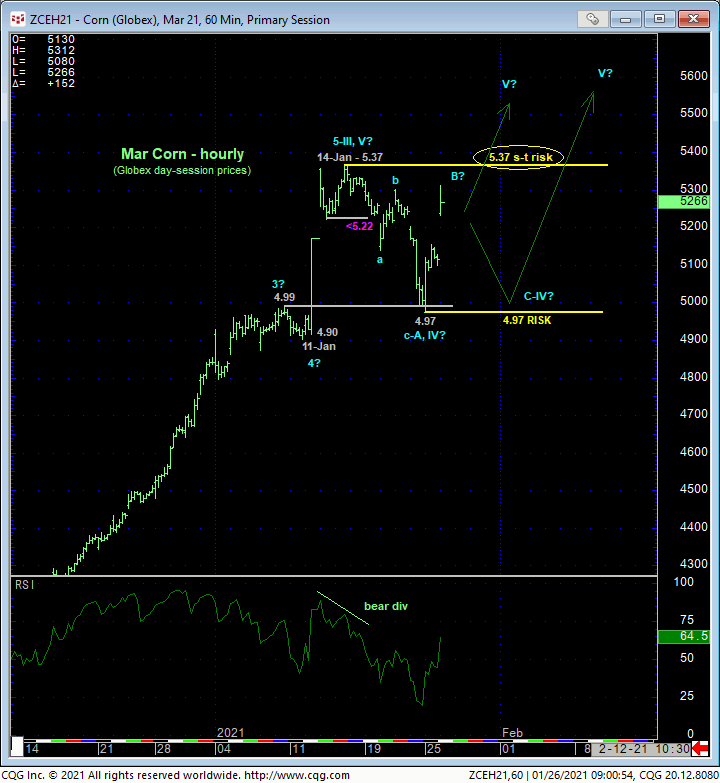
The hourly chart above shows a nice rebound from yesterday’s 4.97 low, but since 14-Jan’s 5.37 high has yet to be recouped, there’s no way to know at this juncture that today’s recovery attempt isn’t just a (B-Wave) hiccup within further lateral-to-lower consolidation that could easily retest or even break yesterday’s 4.97 low. The developing POTENTIAL for a bearish divergence is clear in the daily chart below and will be CONFIRMED on a break below yesterday’s 4.97 low, exposing at least the intermediate-term trend as down.
Once below 4.97, there is no way to know the market’s downside intent. It could trickle through by a couple pennies or melt down and retrace 50% of Aug-Jan’s portion of the bull to the 4.40-to-4.36-area. What we would know with specificity after such a sub-4.97 failure is where the bear (at that point) should NOT trade: above levels like 5.37 that would reinstate the bull. So our risk definition on non-bullish decisions below 4.97 is specific and objective. NOT taking non-bullish action below 4.97 leaves NO levels further down around which to objectively neutralize bullish exposure. That scenario is technically unacceptable to us.
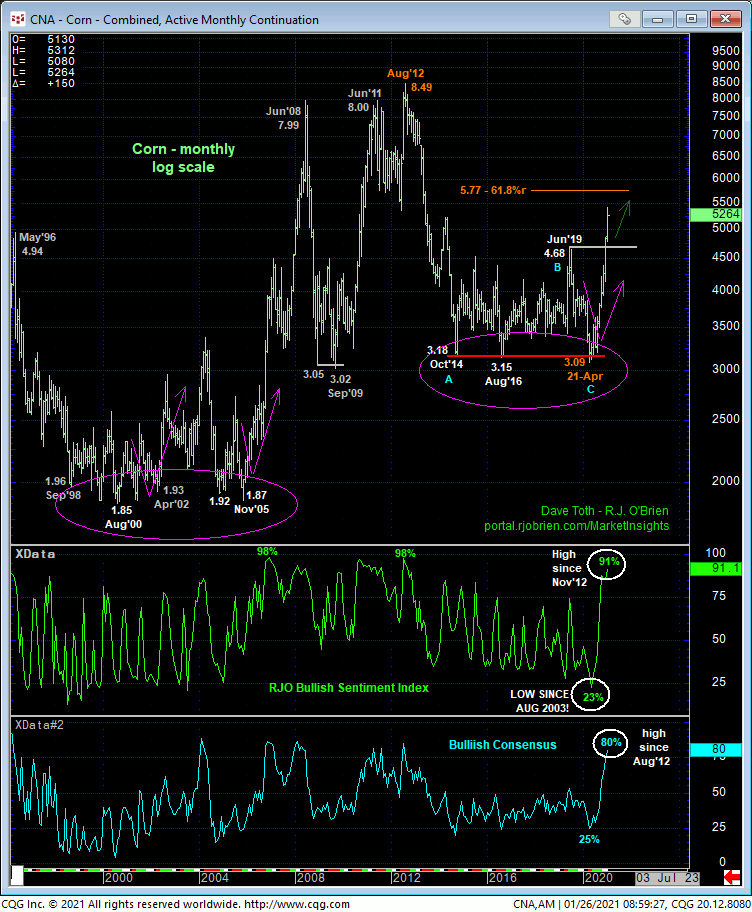
Finally, looking at the historical monthly log chart below, a resumption of the bull above 5.37 once again would expose a universe of space totally void of any technical levels of merit shy of 2012’s 8.49 all-time high. This doesn’t mean we’d be forecasting a move to 8.49. But it certainly does mean that the market’s upside potential would be indeterminable and potentially severe, including a run at 8.49, until and unless derailed by a bearish divergence in momentum.
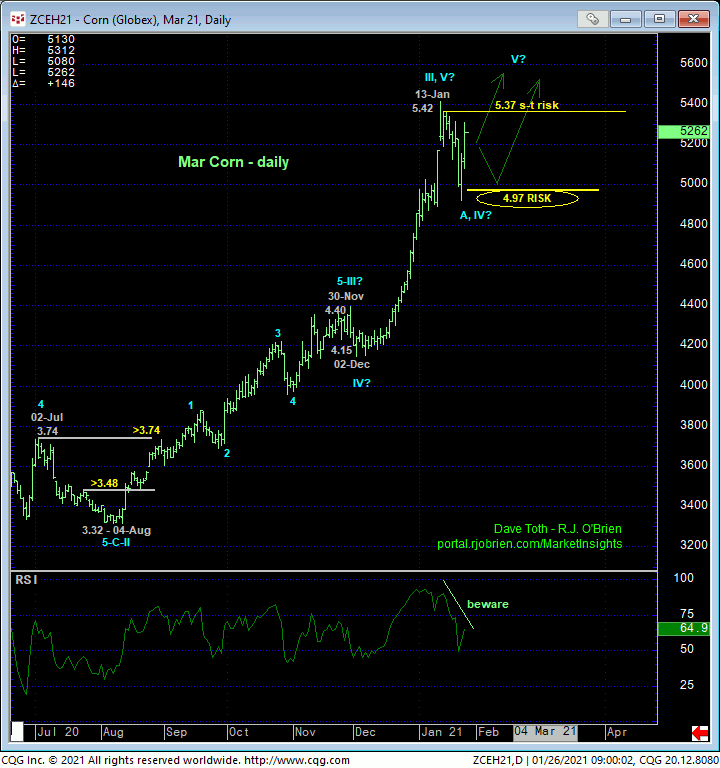
In sum, we believe the market has identified 4.97 and 5.37 as the key technical flexion points heading forward. Traders are advised to toggle directional biases and exposure around these level commensurate with their personal risk profiles (i.e. short-term traders neutral-to-cautiously-bearish until the market recoups 5.37 and longer-term players bullish until threatened by a failure below 4.97).