JUL CORN
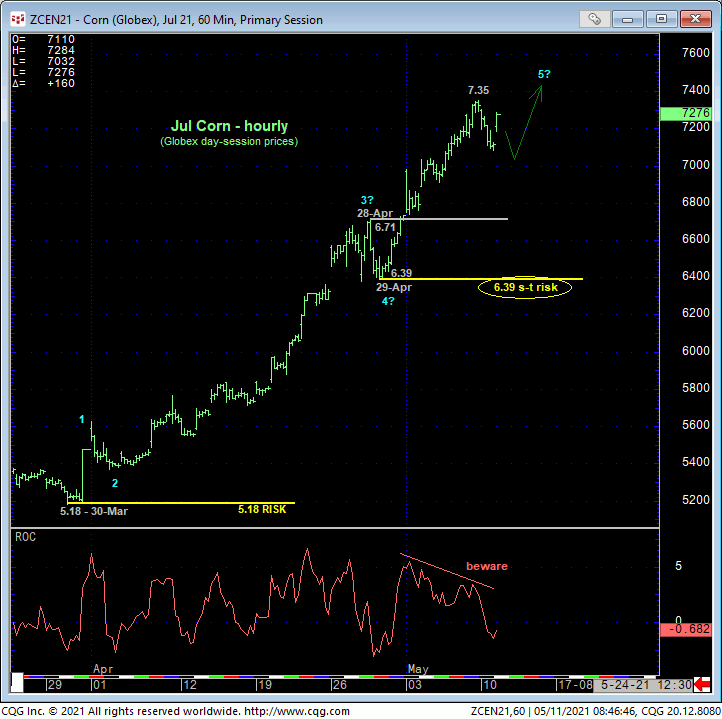
Relative to tomorrow’s crop report (that will likely pale in comparison to the potential impact of the 30-Jun report), there’s not a lot more to say to commercial end-users about the still-screaming bull trend in the Jul contract. The past couple days’ two-bit slip is of a grossly insufficient scale to be considered as anything more than another piddly correction within the secular bull trend that warrants a continued full and aggressive bullish policy and exposure by longer-term players. On this larger-degree scale pertinent to commercial end-users, the market has provided no technical evidence whatsoever to warrant veering from bull hedges.
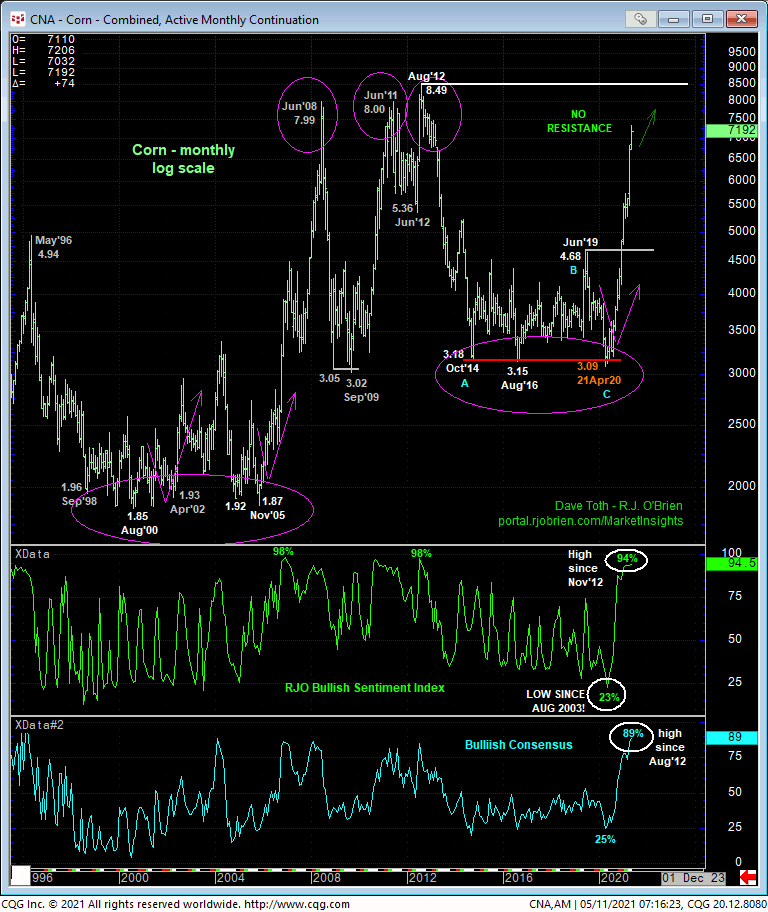
The monthly log chart below shows both the magnitude of this massive bull market and NO levels of any technical merit shy of 2012’s 8.49 all-time high. This does not mean we’re forecasting a move to 8.49. But it certainly does mean that until and unless this market confirms a bearish divergence in momentum of a scale sufficient to threaten the major uptrend, the market’s upside potential remains indeterminable and potentially extreme, including a run at or even through 2012’s all-time high. Being star-struck by admittedly historically extreme prices and fearing not taking advantage of such heights to consider bearish decisions is subjective and emotional and outside the bounds of technical discipline with no objective risk level identified to negate such a decision to warrant its cover.
While the secular bull trend remains intact, we, like everyone on earth, know without a shadow of a doubt of its inevitable end and are on constant vigil for the technical conditions typical of virtually all major trend reversals like:
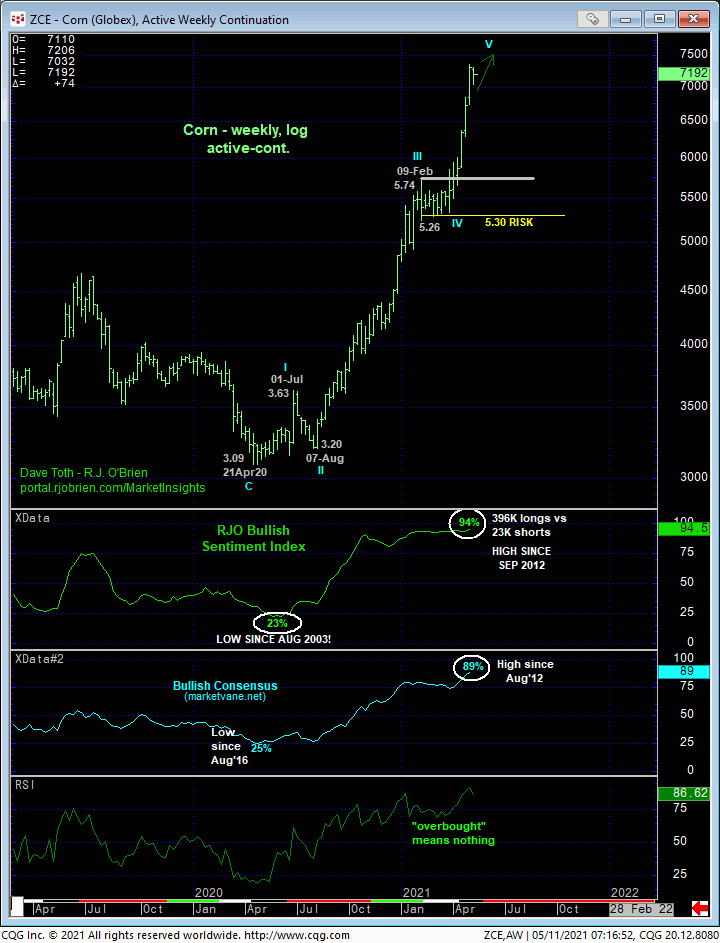
- historically frothy levels of market sentiment/contrary opinion clear in the weekly log chart below
- the prospect that the rally from 30-Mar’s 5.18 low is the completing 5th-Wave to a massive 5-wave Elliott sequence from Apr’20’s 3.09 low
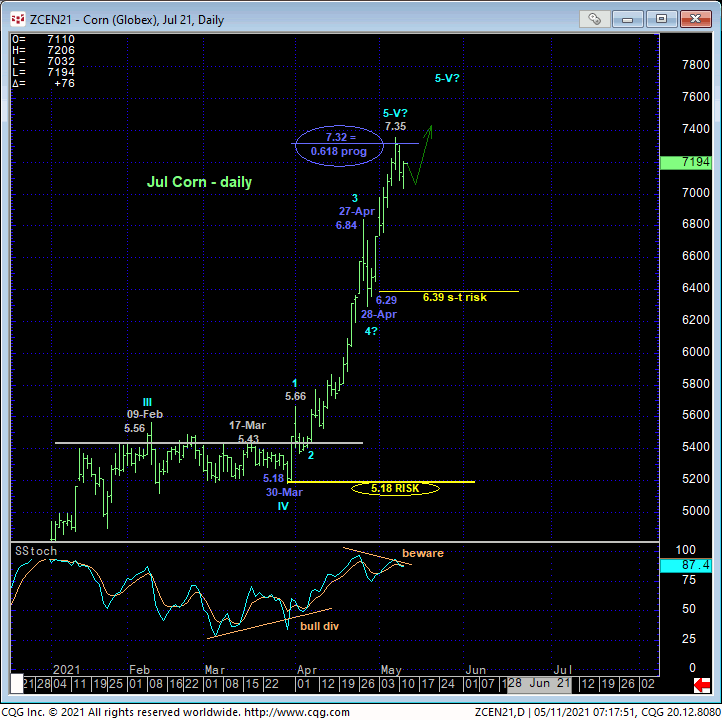
- the prospect that the rally from 28-Apr’s 6.29 overnight low is the completing 5th-Wave to a 5-wave Elliott sequence up from 30-Mar’s 5.18 low with
- this prospective 5th-Wave spanning a length within 3-cents of its (7.32) 0.618 progression of the net length of waves-1-thru-3 (5.18 – 6.84).
The problem at this point with these observations is that NONE of them matter until and unless the market breaks the clear, major and simple uptrend pattern of higher highs and higher lows on a scale sufficient to even defer, let alone threaten the secular bull. MINIMALLY, this market would have to break 29-Apr’s Globex day-session low of 6.39 to break even the uptrend from 30-Mar’s 5.18 low, let alone threaten then secular bull. Looking again at the weekly log chart above, long-term players must ask themselves, “What does the market need to do to break the secular bull trend?” The answer is a failure below the 5.30-area that marks the bottom of the Feb-Mar correction/consolidation. Arguably, a 0.50-cent-to-a-dollar setback would fall within the bounds of a mere correction relative to this massive bull trend.
Again, we all know this bull will eventually end and present as outstanding a risk/reward opportunity from the bear side as QUARTERS of similar but inverted basing behavior and indicators from sub-3.50 levels presented the outstanding bullish opportunity from summer 2020. BUT now as last year, this raging bull needs to satisfy our three reversal requirements before we can objectively go the other way:
- a confirmed bearish divergence in momentum of a scale sufficient to even threaten, let alone break the major bull trend
- proof of trendy, impulsive 5-wave-looking price action on the initial counter-trend break, and, most importantly,
- proof of labored, 3-wave corrective behavior on the subsequent rebuttal to that initial counter-trend break.
This market has yet to satisfy ANY of these requirements on even a very short-term basis, let alone a scale pertinent to the major bull.
Drilling down even further, the hourly chart below shows the still-unfolding uptrend where a failure below at least former 6.71-area resistance-turned-support is MINIMALLY required to threaten the clear and present uptrend from even 29-Apr’s 6.39 smaller-degree corrective low and short-term risk parameter.
In sum and especially given the sheer magnitude of this massive bull trend, the market has yet to show one iota of “non-strength” necessary to even pare bullish exposure, let alone think about a developing top. Per such, a bullish policy and exposure remain advised with a failure below at least 6.39 required to satisfy even the first of our three reversal requirements on even a short-term basis. Until and unless such weakness is proven, further and possibly accelerated gains remain anticipated.
Lastly, we would remind traders of all scales to keep our three reversal requirements in mind for the next month or two. Because before this thing ultimately peaks out, it remains likely that it will provide evidence of slowing before doing so. This evidence will likely take the form of increasingly bigger setback attempts and resumptions of the bull, raising volatility even higher. The so-called easy, trending money is behind us, with increasingly challenging, whippy price action ahead and before this market ultimately peaks. This behavior may be navigated a little easier if the three reversal requirement game plan is kept in mind.
DEC CORN
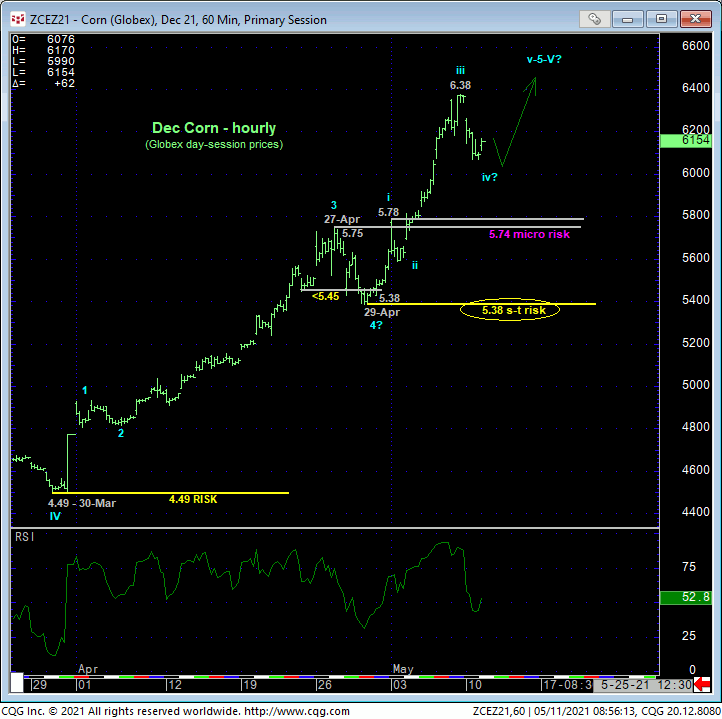
The technical construct and expectations for new crop Dec are identical to those detailed above in the Jul contract with smaller- and larger-degree corrective lows and short- and long-term risk parameters in place at 5.38 and 4.49, respectively. Former 5.75-area resistance from late-Apr/early-May is considered new near-term support and a minimum level/area this market should be expected to fail below to even defer, let alone threaten the bull. Until and unless such weakness is proven, the trend remains up on all but the tiniest of scales (due to the past couple days’ slip) and is expected to continue and perhaps even accelerate. Per such, a bullish policy and exposure remain advised until and unless this market fails below at least 5.75 and preferably 5.38.
For producers who’d prefer to buck this clear and present and major uptrend in exchange for a bear hedge ahead of tomorrow’s crop report, we discuss three strategies below with fixed and limited risk/cost in the likely event this major bull continues.
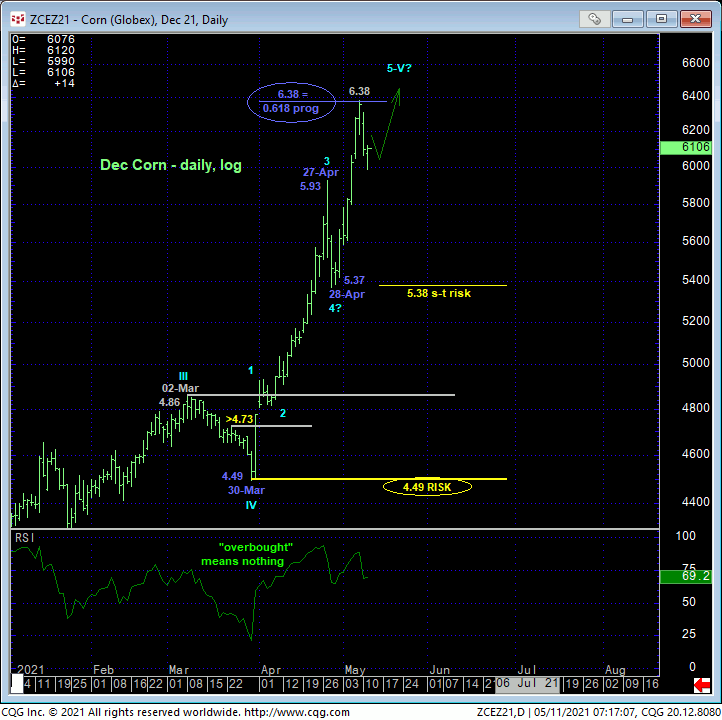
JUN SHORT-DATED 5.90 – DEC 4.70 PUT DIAGONAL
Even if tomorrow’s crop report includes a bearish surprise, for both technical and fundamental reasons (i.e. the bigger 30-Jun report) any relapse is likely to either be temporary and corrective ahead of the bull’s resumption or just the initial (A- or 1st-Wave) of a broader peak/correction/reversal threat that is very likely to be rebutted by a subsequent (B- or 2nd-Wave) rebound. The forces behind this mega-bull are unlikely to evaporate overnight and will likely require WEEKS of peaking/reversal behavior to top this thing out. Tomorrow’s report is an unlikely candidate to kill this bullish beast.
The Jun short-dated 5.90 – Dec 4.70 put diagonal spread provides:
- a current net delta of -17%
- gamma ratio of over 5:1
- negligible risk if the major bull trend continues
- profit potential of 1.20 IF IF IF this market maintains a bear-hedge-requiring and sustained meltdown below 5.90 over the next 10 days to expiration of the Jun options (for those interested in hedging downside, this presumes a bearish surprise from tomorrow’s report).
As with all long-gamma diagonal spreads however, the market is required to trend sharply in the direction of the spread straight away. Dawdling around laterally over the next week or so and especially following tomorrow’s crop report would start to mitigate this strategy’s rationale that should ultimately warrant its cover. Allowing the long 5.90 put to expire worthless, leaving a naked short 4.70 put in Dec exposes unlimited risk and should be avoided at all costs by simply covering this bearish punt/quasi-hedge in the event it is not immediately rewarded by sharp losses following tomorrow’s report.
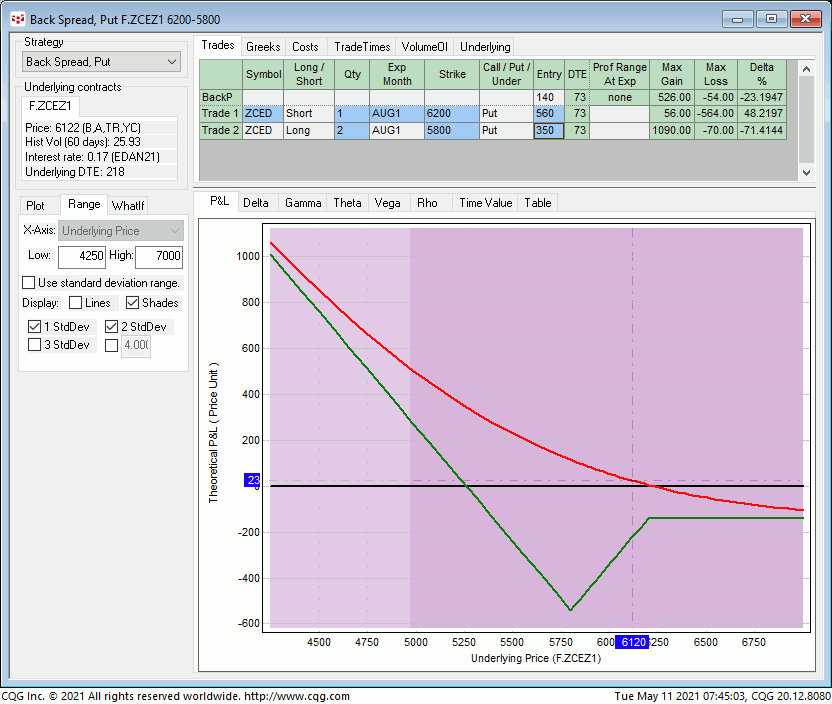
AUG SHORT-DATED 6.20 – 5.80 BACKSPREAD
Here too, the rationale behind this backspread is the limited and fixed risk/cost if the major bull trend continues following tomorrow’s report. This strategy includes selling 1-unit of the Aug short-dated 6.20 puts around 56-cents and buying 2-units of the Aug short-dated 5.80 puts around 35-cents for a net cost of about 14-cents. This strategy provides:
- a current net delta of -23%
- fixed, maximum risk/cost of 14-cents on ANY continuation of the secular bull trend
- maximum risk/cost of 54-cents if the underlying Dec contract settles at 5.80 73 days from now at expiration
- unlimited, dollar-for-dollar downside hedge protection below its 5.26 breakeven point at expiration.
The relatively high cost of this strategy is due to the use of the Aug short-dated options that will cover the key 30-Jun crop report. Another intention of this strategy is that its highest risk/cost would stem from the market remaining around current 6.20-area levels. In effect, this strategy is making a bet on a move away from current levels, stemming either from a continuation of the major bull trend (where the risk/cost is less) OR a bearish surprise from either tomorrow and/or 30-Jun’s crop report(s).
JUN SHORT-DATED 6.20 – 6.00 BACKSPREAD
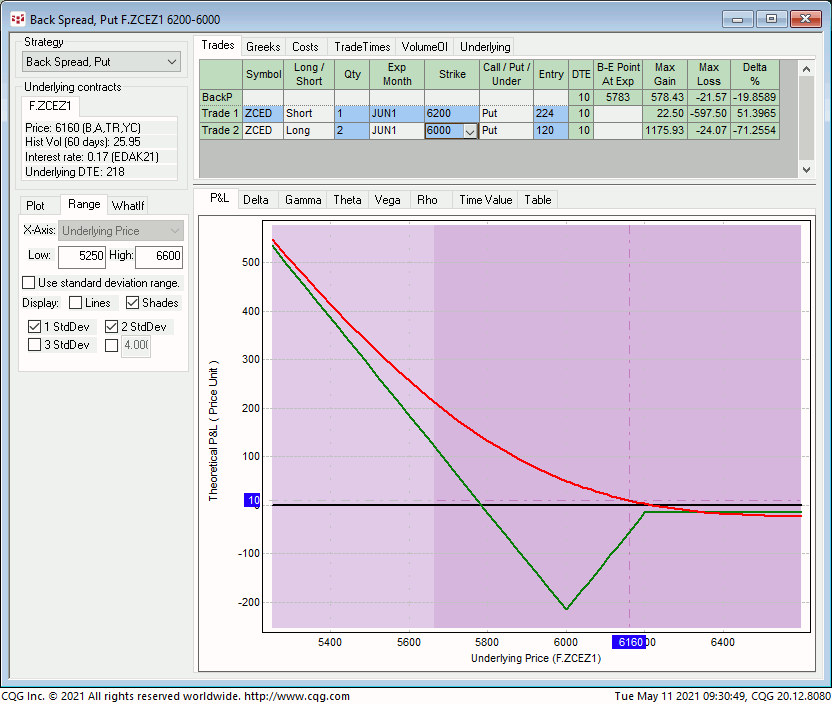
The Jun short-dated 6.20 – 6.00 backspread is identical in theory to the strategy above, using the Jun short-dated options instead of the Aug, removing two months of time premium. This strategy includes selling 1-unit of the Jun short-dated 6.20 puts around 22-1/2-cents and buying 2-units of the Jun short-dated 6.00 puts around 12-cents for a net cost of about 1-1/2-cents, considerably less than the 14-cents paid for the similar strategy in Aug. The trade-off, of course, is that the market would have to tank straight away, presumably from tomorrow’s crop report, for this bear hedge to serve its intended purpose. This strategy provides:
- a current net delta of -20%
- fixed, maximum risk/cost of 1-1/2-cents on ANY continuation of the secular bull trend
- maximum risk/cost of 21-1/2-cents if the underlying Dec contract settles at 6.00 10 days from now at 21-May expiration
- unlimited, dollar-for-dollar downside hedge protection below its 5.78 breakeven point at expiration.
Here too, an intention of this strategy is that its highest risk/cost would stem from the market remaining around current 6.10-to-6.00-area levels. In effect, this strategy is making a bet on a move away from current levels, stemming either from a continuation of the major bull trend (where the risk/cost is less) OR a bearish surprise from tomorrow crop report.
Please contact your RJO representative for updated bid-offer quotes on these strategies.
