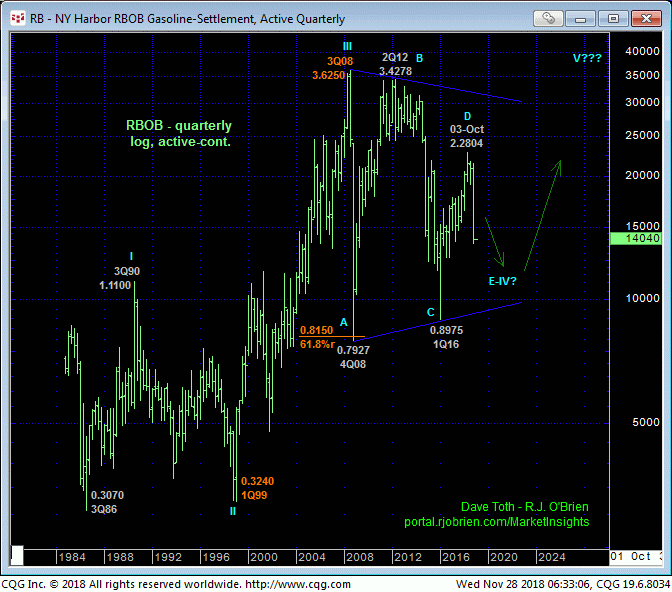
Far be it from us trying to “curve-fit” a wave count into the sharply falling knives that still describe the technical conditions of both the crude oil and RBOB markets. The trends remain down on all scales in both markets and should not surprise by their continuance or acceleration. But because of slight slowdowns in the RATE of descent in both, these markets have been accommodative in defining specific smaller- and larger-degree corrective highs these markets now are required to sustain losses below to maintain more immediate bearish counts. Their failure to do so would warn of COMPLETE 5-wave structures down from their respective 03-Oct highs and warn of corrections higher that could be major in scope.
DEC CRUDE OIL
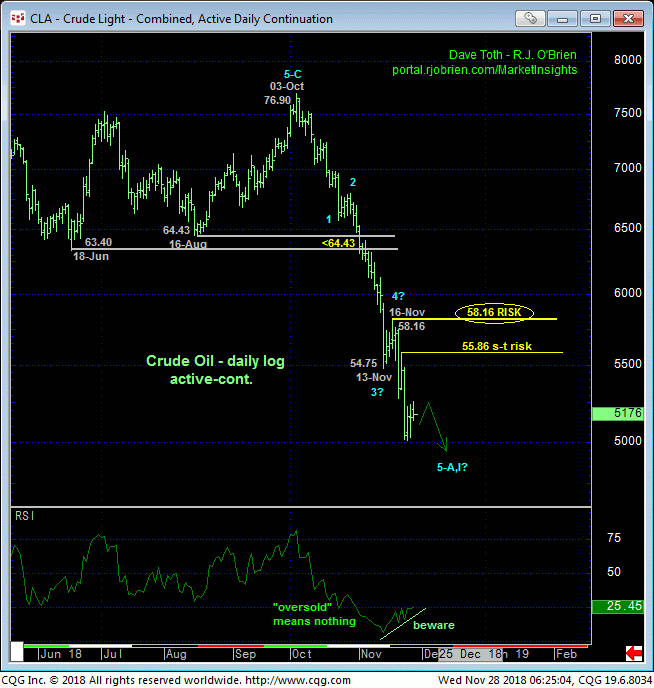
We’ve taken a stab at counting the wave sequence down from 03-Oct’s 76.90 high in the daily log chart below. While we NEVER RELY on such a subjective count to make non-bearish bets starting with short-covers that would violate our “trend is your friend” discipline, the market has, in fact, identified smaller- and larger-degree corrective highs at 55.86 and 58.16, respectively, that it is now required to sustain losses below to maintain a more immediate bearish count.
The slowdown in the RATE of descent- a common occurrence before reversals- is clearly indicated in the RSI measure of momentum. Unlike “oversold” references that are always useless and outside the bounds of technical discipline, this slowed rate of descent merits attention. But even with this POTENTIAL for a bullish divergence in momentum, PROOF of strength above prior corrective highs like 58.16 and even 55.86 is required to CONFIRM the signal to the point of non-bearish action like short-covers and cautious bullish punts.
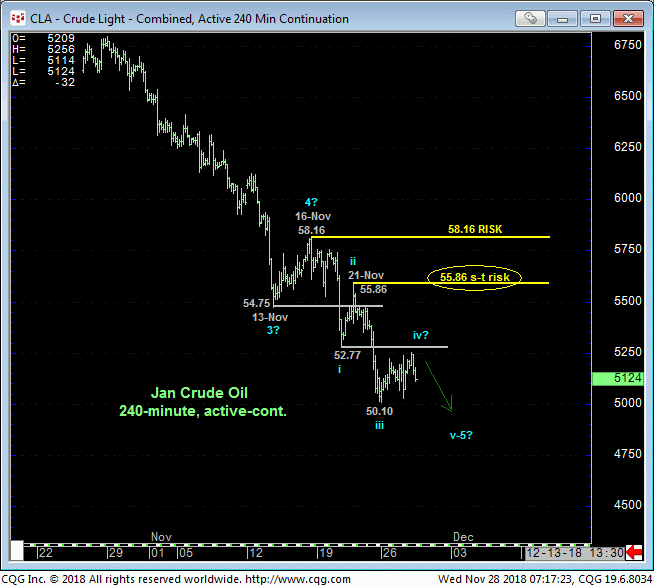
IF the portion of the decline from 16-Nov’s 58.16 high is the completing 5th-Wave of an Elliott sequence down from 03-Oct’s 76.90 high, then somewhere along the near-term line this market needs to break the simple downtrend pattern of lower lows and lower highs. And while a recovery above 58.16 will certainly confirm such, Fri’s resumed slide below 20-Nov’s 52.77 low leaves 21-Nov’s 55.86 high as the latest smaller-degree corrective high and new short-term risk parameter this market is now minimally required to recoup to jeopardize the trendy, impulsive integrity of a continued bearish count.
If the market makes another round of new lows below 50.10, this shorter-term risk parameter will be able to be trailed once again to the new latest smaller-degree corrective high left in the wake of those new lows.
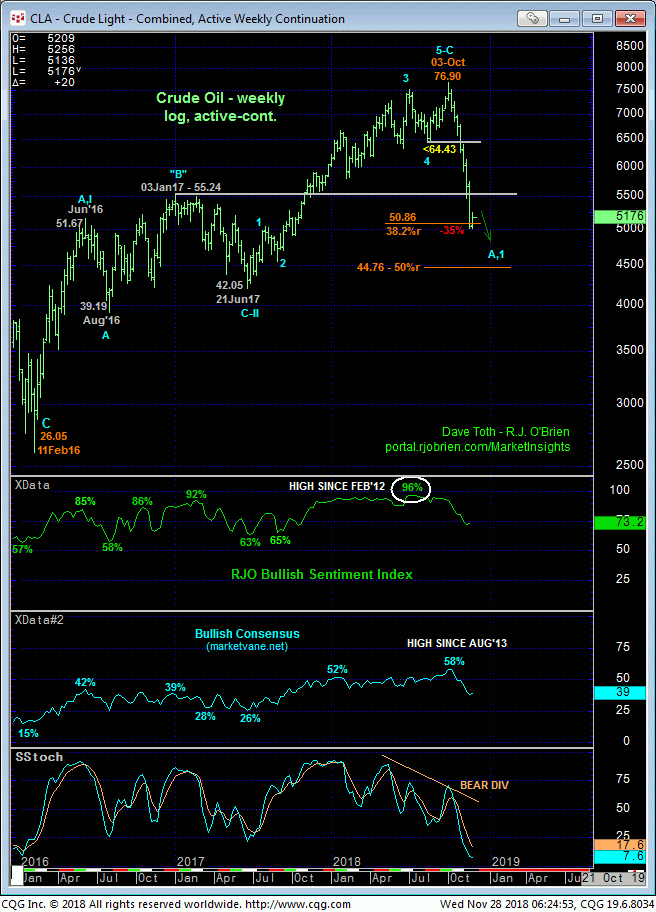
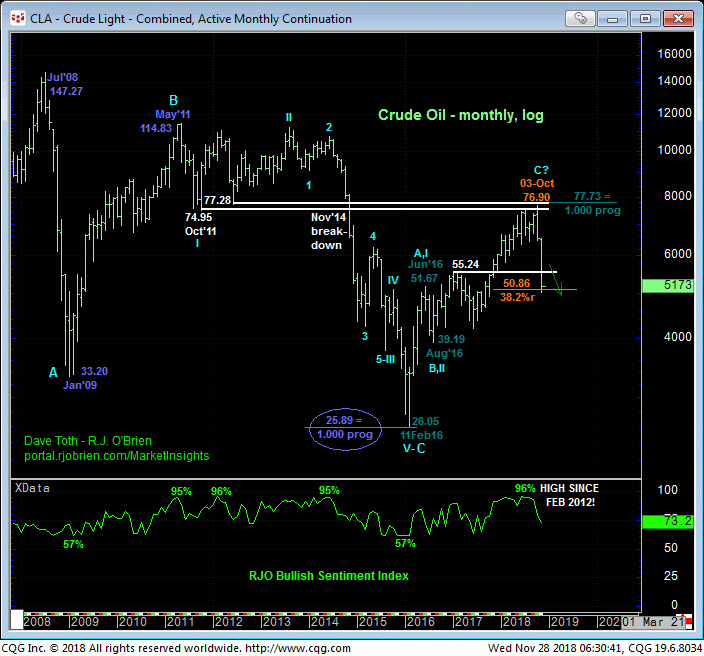
The weekly (above) and monthly (below) log scale charts show the reversal carnage that can result from the typical peak/reversal combination of a confirmed bearish divergence in momentum amidst historically frothy bullish sentiment. We introduced this threat as early as in 12-Oct’s technical Blog with extraordinary bullish sentiment not seen since at least five years in the Bullish Consensus and since Feb 2012 in our RJO Bullish Sentiment Index of the hot Managed Money positions reportable to the CFTC. 01-Nov’s subsequent failure below 16-Aug’s 64.43 larger-degree corrective low, in fact, broke at least the 16-month uptrend from Jun’17’s 42.05 low and exposed the rest of the meltdown that remains intact today.
The market has lost 35% thus far and is flirting with the (50.86) 38.2% retrace of the entire bull market from Feb’16’s 26.05 low to 03Oct18’s 76.90 high. But traders are reminded hat merely “derived” technical levels like Bollinger Bands, imokus, trend line, the ever-useless moving averages and even the vaunted Fibonacci relationships we cite often in our analysis have NEVER proven to be reliable reasons to identify support (or resistance) without an accompanying bullish (in this case) divergence in momentum needed to stem the clear and present downtrend. And they never will.
The only thing that matters in such a, frankly, simple down-trending market as we currently have is MOMENTUM, and more specifically, the prior corrective highs like 58.16 and even 55.86 that this market is now required to recoup to threaten or break the clear and present downtrend. Until and unless such strength is shown, the trend is down and is expected to continue and perhaps even accelerate.
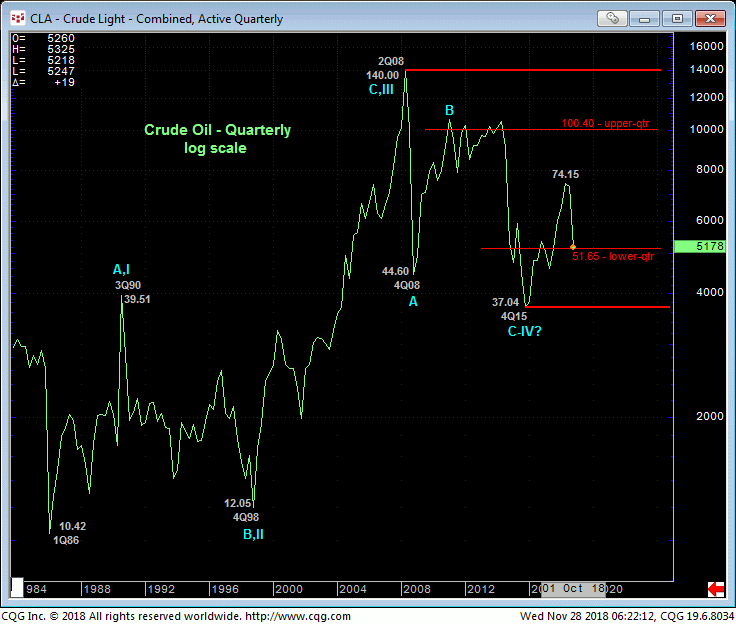
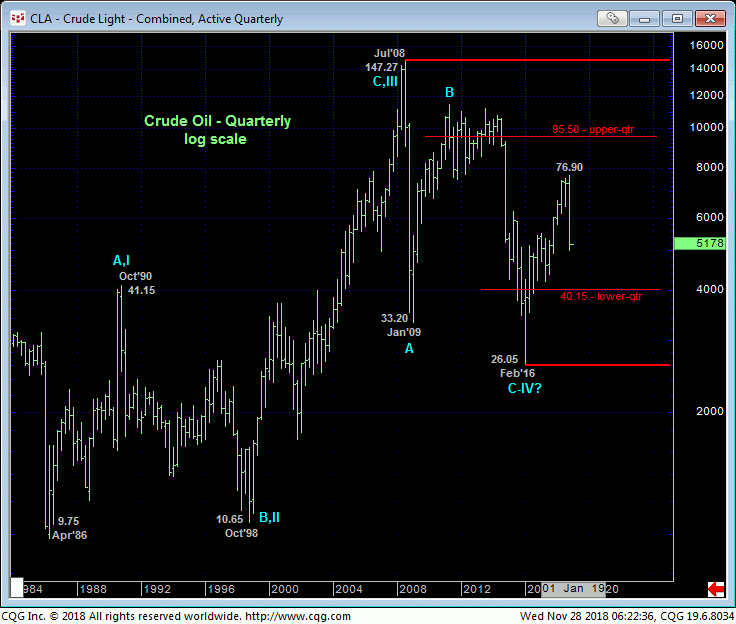
From a long-term historical perspective, the quarterly log close-only chart above and quarterly log chart below show the market’s entrapment in the middle-half of the past 10 YEARS’ range between 147 and 26. We discuss often the greater odds of aimless whipsaw risk from such range-center environs, and on this historic scale this could mean wild swings between 35 and 100 for years or even decades to come.
The quarterly close-only chart is particularly interesting because by cleaning out the intra-quarter “noise”, this perspective shows the market thus far holding ABOVE the approximate 35-to-40-area that capped this market for 20 years before mid-2004’s obliteration of that cap. Looking years or perhaps even decades forward, it may not come as too much of a surprise that this 35-to-40-area marks the LOWER-BOUNDARY of the new historical range. And on a weekly log close-only basis, the market is engaging the lower-quarter of this range between about 51.50 and 37 where a bullish divergence in momentum above a level like 58.16 could expose an extensive, if intra-10-year-range recovery. Until and unless such a bullish divergence in momentum is CONFIRMED however, further losses to the 40-area or below should not surprise.
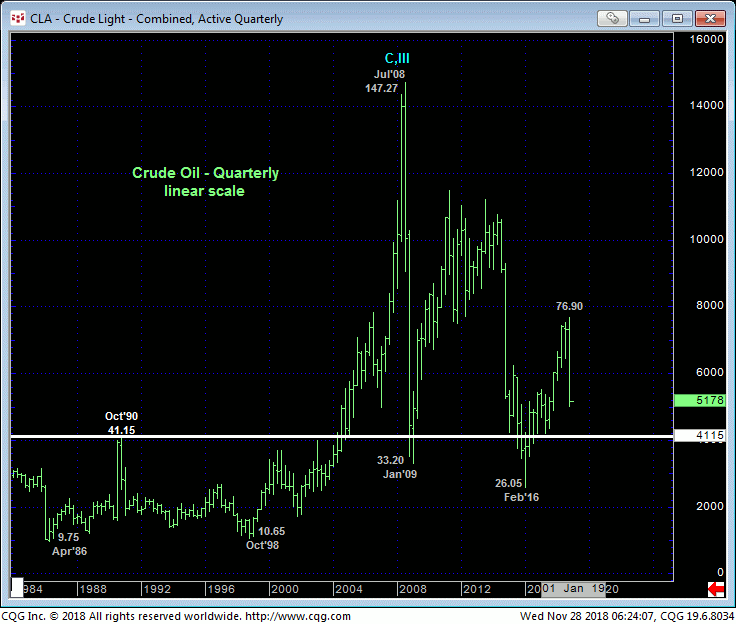
Just for giggles, we included a quarterly chart on a LINEAR scale below to show the huge difference between it and percentage movements on a log scale above. We have little use for such linear charts when looking at very long-term pattern analysis when major directional moves are concerned. But this chart shows an interesting historical perspective of that 35-to-40 cap before it was blown away by 2004’s explosive rally and subsequent years of volatility that now suggests relapses to that 40-area may prove to be excellent long-term buys.
In sum, the trend is down on all scales and is expected to continue and perhaps accelerate. We have discussed a couple momentum and wave reasons to be watchful to an end to the current meltdown, but such a path and game plan is totally dependent on the market’s ability to recover, first above 55.86 and ultimately above 58.16. Until and unless such strength is shown, a full and aggressive bearish policy and exposure remain advised as the market’s downside potential remains as indeterminable and potentially severe now as it was a week or a month ago.
JAN RBOB
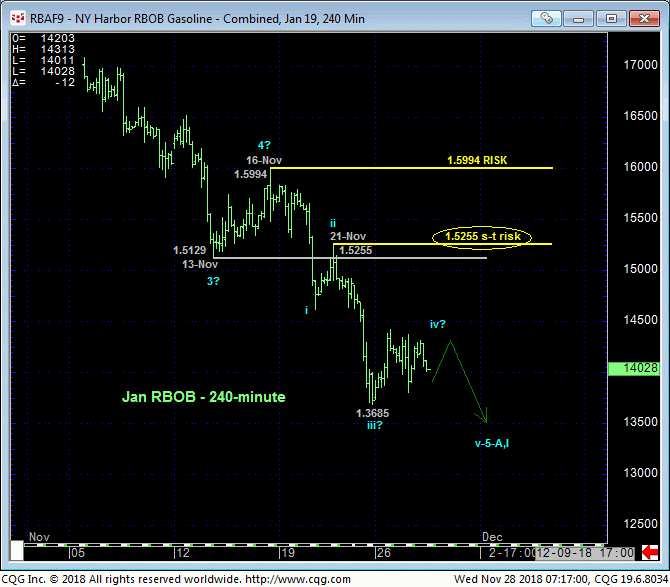
The technical construct and expectations for the RBOB market are virtually identical to those detailed above in crude oil with smaller- and larger-degree corrective highs and short- and long-term risk parameters to a still-advised bearish policy cutting across at 1.5255 and 1.5994, respectively. These levels are noted in the 240-min chart above and daily log chart below.
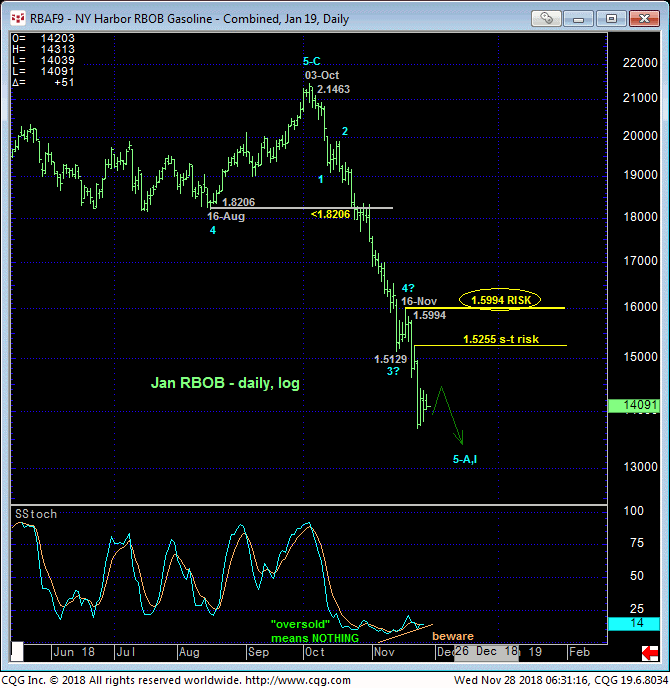
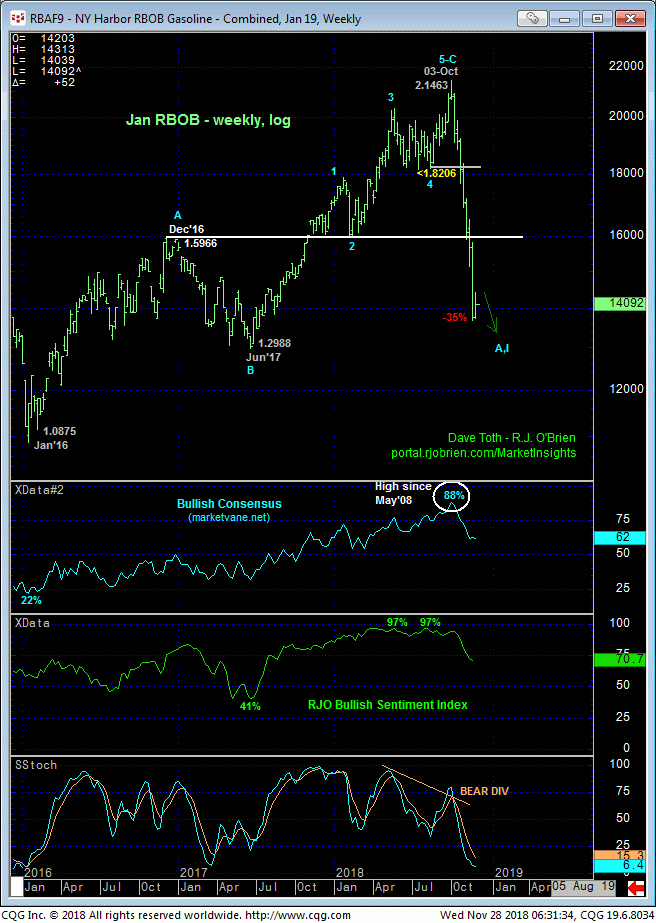
As with crude, the combination of gross bullish sentiment and momentum failures discussed as early as in 17-Oct’s Technical Webcast left the market vulnerable to the type of collapse that followed. 24-Oct’s failure below 16-Aug’s 1.8206 major corrective low broke the uptrend from at least Jun’17’s 1.2988 low and confirmed another intra-10-year-range decline shown in the monthly log chart below. We’ve noted a couple Fibonacci retracement and progression relationships at 1.2815 and 99.62, but the only thing that matters at this juncture is MOMENTUM and the market’s ability to recoup corrective highs like 1.5994 and even 1.5255. In lieu of such strength the market’s remaining downside potential remains indeterminable and potentially severe.
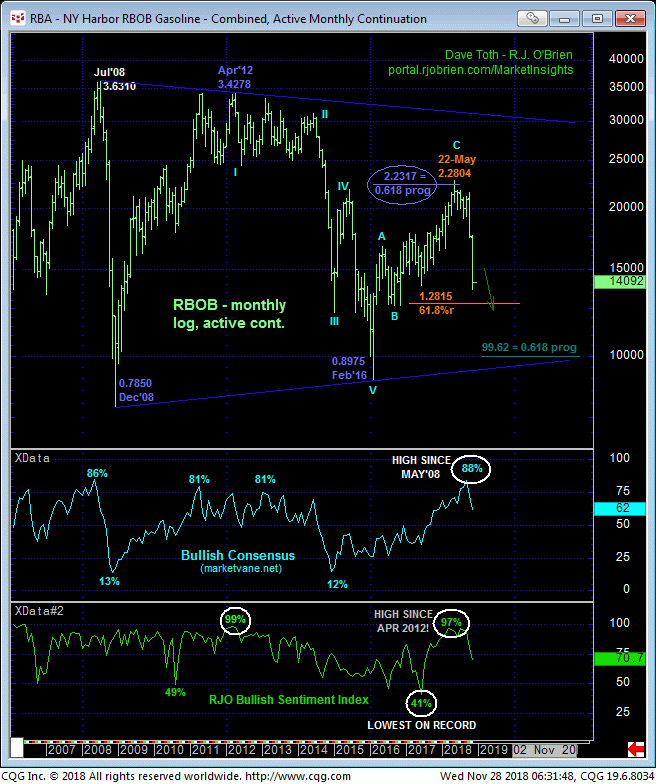
Finally, we find this quarterly log chart below interesting in that, like crude, it shows a wild but lateral/triangular range over the past 10 YEARS that remains generally ABOVE the 20 years of prior resistance from the 1.000-area. As our wave count suggests, we’re not necessarily holding out or calling for an eventual massive 5th-Wave rally to 3.60 or higher. But this chart does show sharp drops to the lower recesses of this range being relatively short-lived. Another month or two of historic but intra-range emotional bashing could present an outstanding risk/reward buy. We will cross that bridge when the market gets us there.
In sum, a full and aggressive bearish policy remains advised with a recovery above at least 1.5255 required to threaten this call enough to warrant a move to the sidelines. In lieu of such strength further and possibly accelerated losses should not surprise.
