SEP RBOB
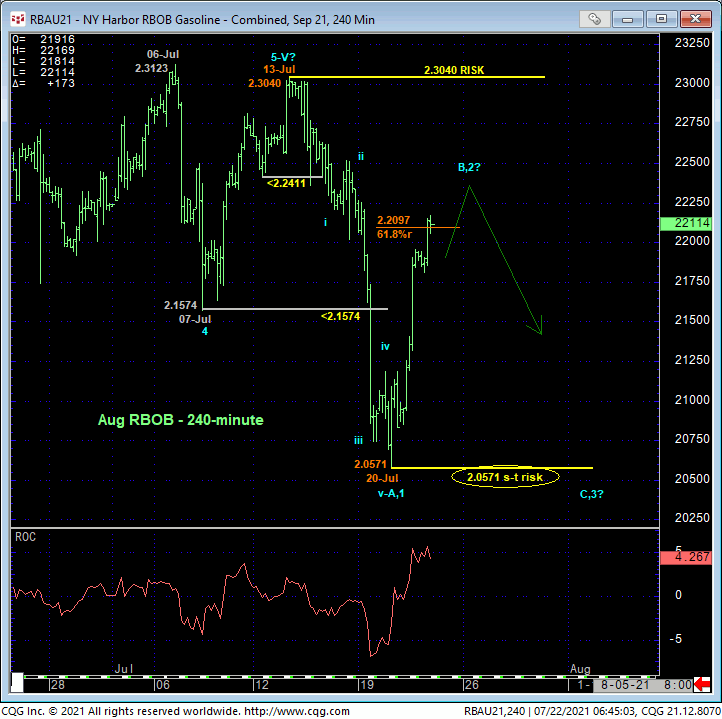
It’s clear that the market recovered enough yesterday to identify Tue’s 2.0571 low as the end of the decline from 13-Jul’s 2.3040 high. Per such, this 2.0571 low serves as a risk parameter from which non-bearish decisions like short-covers can be objectively based and managed. While 13-Jul’s key 2.3040 high remains intact however, Tue’s 2.0571 low also serves as a key measuring stick for the bull. For momentum, contrary opinion and Elliott Wave reasons we’ll discuss below, Tue’s 2.0571 low serves as the level this market now needs to sustain gains above to NEGATE a broader peak/reversal count, contending that mid-Jul’s sell-off is just another correction within the secular bull trend. While a recovery above 13-Jul’s 2.3040 high remains required to reinstate the secular bull, a failure below 2.0571 will certainly reinforce a broader peak/reversal threat. Traders are advised to toggle directional biases and exposure around these two rather obvious thresholds commensurate with their personal risk profiles.
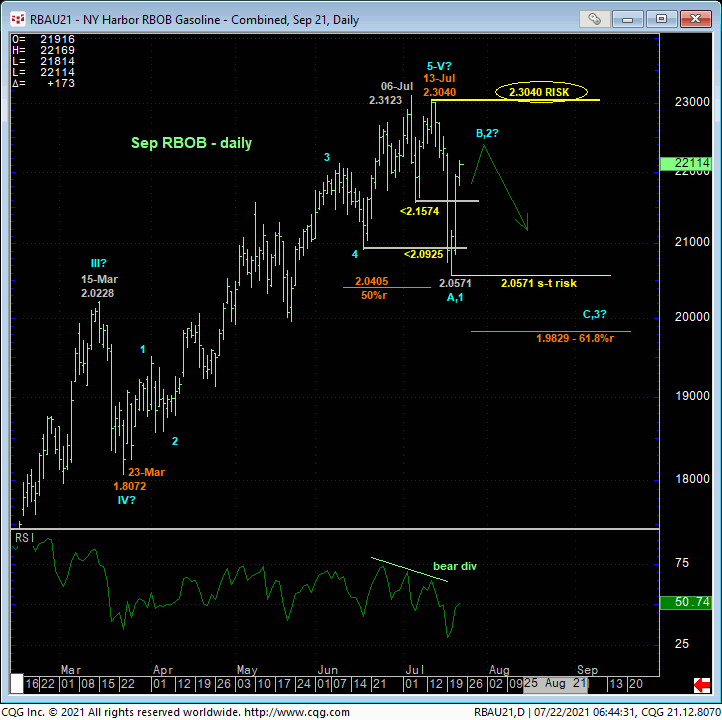
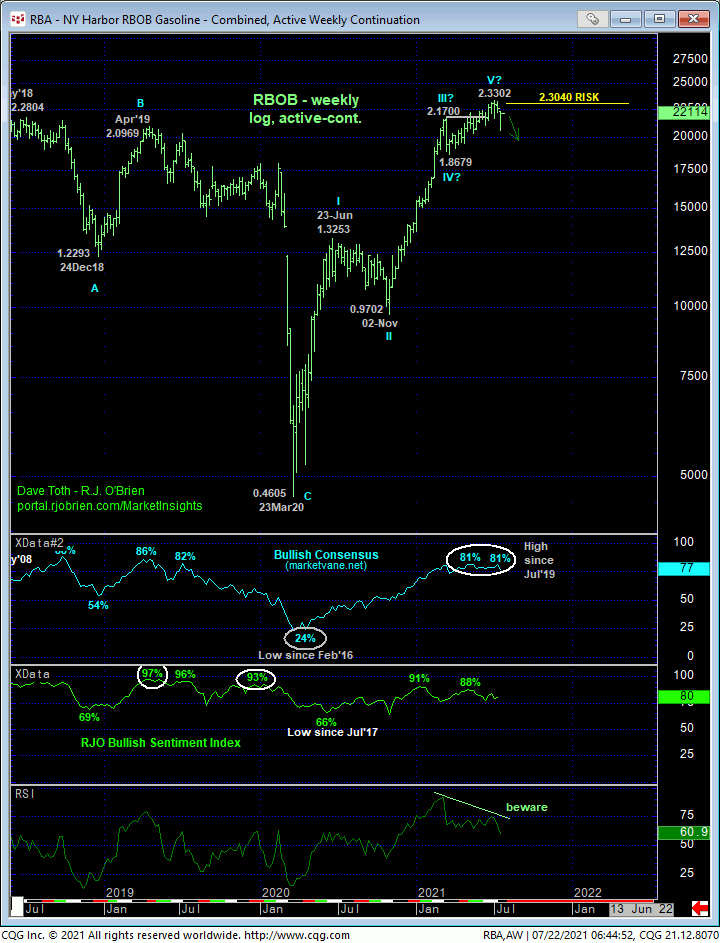
On a broader daily basis, there is no question that the extent of mid-Jul’s relapse below TWO prior corrective lows at 2.1926 and 2.1253 broke Mar-Jul’s uptrend and defines 13-Jul’s 2.3017 high close as the end of a textbook 5-wave Elliott sequence from 23-Mar’s 1.8251 low close. This fact defines that 2.3017 high as THE key risk parameter this market needs to recoup to negate the call for a larger0-degree correction or perhaps a major reversal lower. On a daily high-low basis above, 13-Jul’s 2.3040 intra-day high serves as that 5th-Wave “failure” high (falling shy of 06-Jul’s 2.3123 intra-day high) as our key bear risk parameter on an intra-day basis.
Until and unless the market recoups these 13-Jul highs, the current recovery attempt is advised to first be approached as a (B- or 2nd-Wave) corrective selling opportunity. However, a confirmed bearish divergence in short-term momentum is required to stem this recovery and reject/define a more reliable high and resistance from which any bearish decisions can only then be more objectively based and managed.
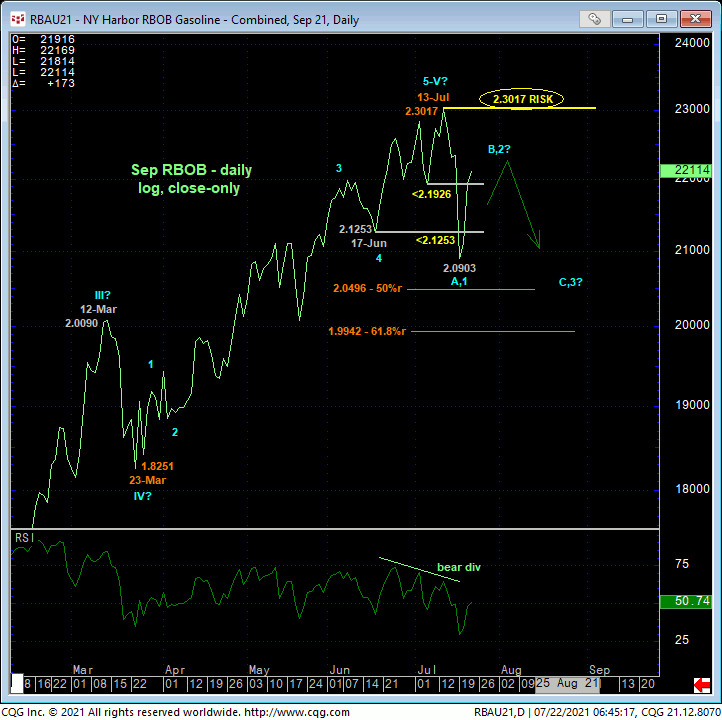
Complicit in this broader peak/correction/reversal-threat environment are historically frothy sentiment/contrary opinion levels and upside momentum that’s arguably been waning for months on a weekly log scale basis below. To mitigate this threat, the market needs to close above 2.3017 and/or recover above 2.3040.
These issues considered, a neutral/sideline policy is advised for the time being, with a bearish divergence in short-term momentum from some level shy of the key 13-Jul highs needed to present what could be an acute risk/reward selling opportunity ahead of potentially protracted losses below 2.05.
SEP HEATING OIL
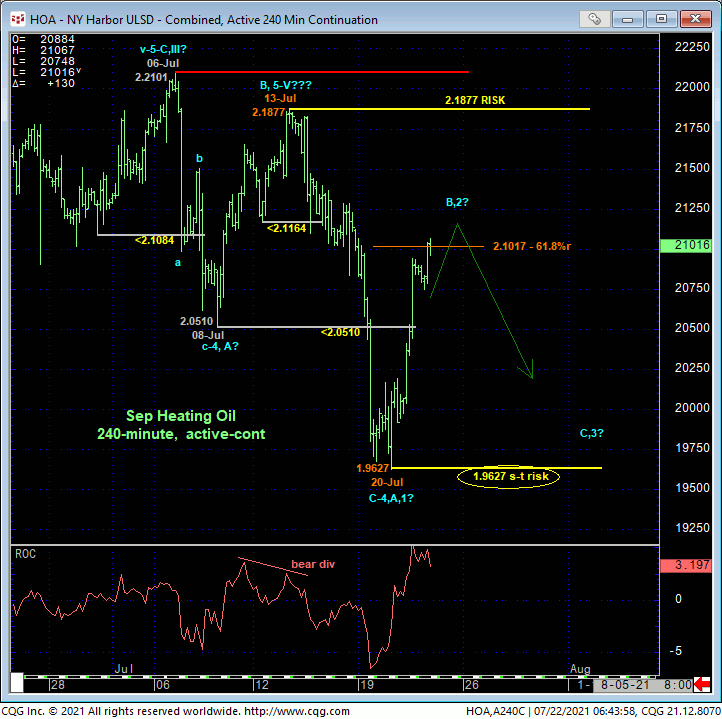
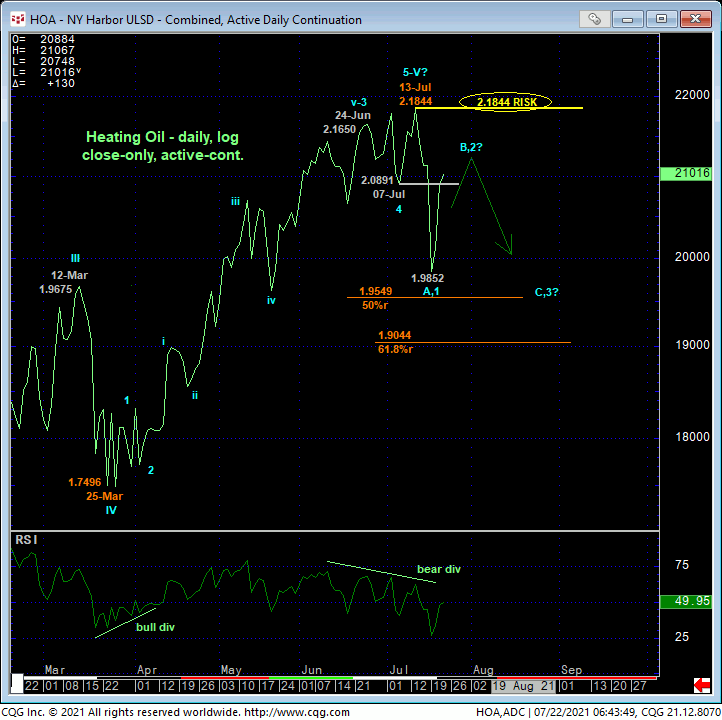
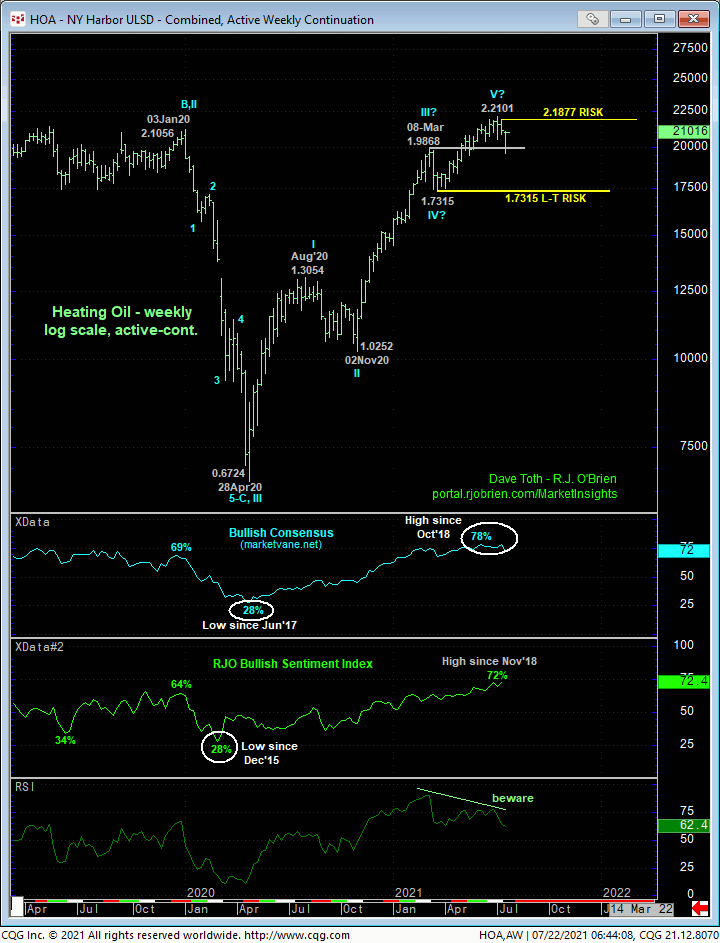
The technical construct and expectations for heating oil are identical to those detailed above in RBOB with 13-Jul’s 2.1877 intra-day high (2.1844 close) and Tue’s 1.9627 low considered the key flexion points heading forward. Here too, we will keep a keen eye on any short-term bearish divergence in momentum needed to arrest the current rebound attempt to present an acute risk/reward opportunity from the sell side.
SEP CRUDE OIL
Similarly, this week’s rebound in crude is sufficient to identify Tue’s 65.01 low as the end of the decline from 13-Jul’s 75.52 high. But until and unless this market can resurrect strength above that 75.52 high and key risk parameter, we have to acknowledge mid-Jul’s decline from 75.52 to 65.01 as the prospective A- or 1st-Wave of a more protracted correction or reversal lower. IF this is the case, then somewhere between spot and that 75.52 high, we would expect the market to arrest the current rebound with a confirmed bearish divergence in short-term momentum. If/when such a mo failure rejects/defines a more reliable high and resistance, we believe an acute risk/reward selling opportunity will be presented.
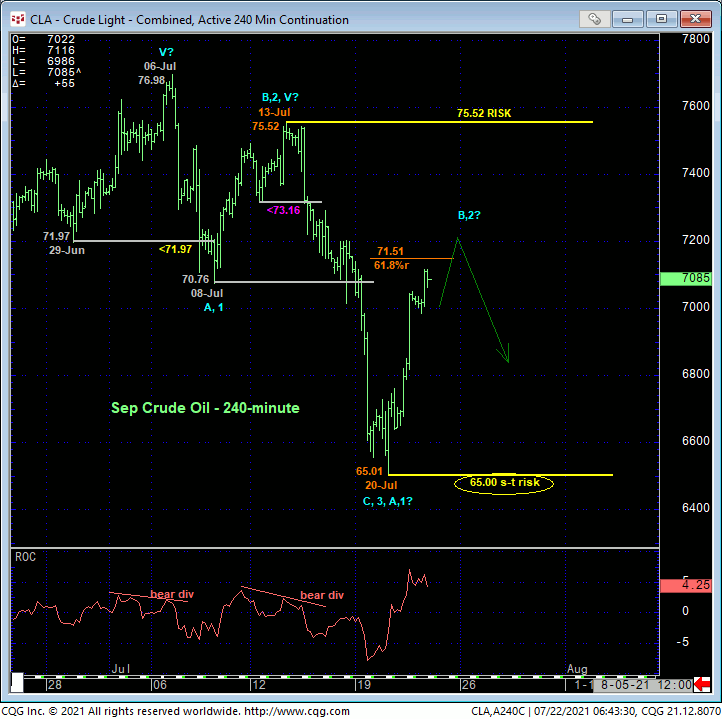
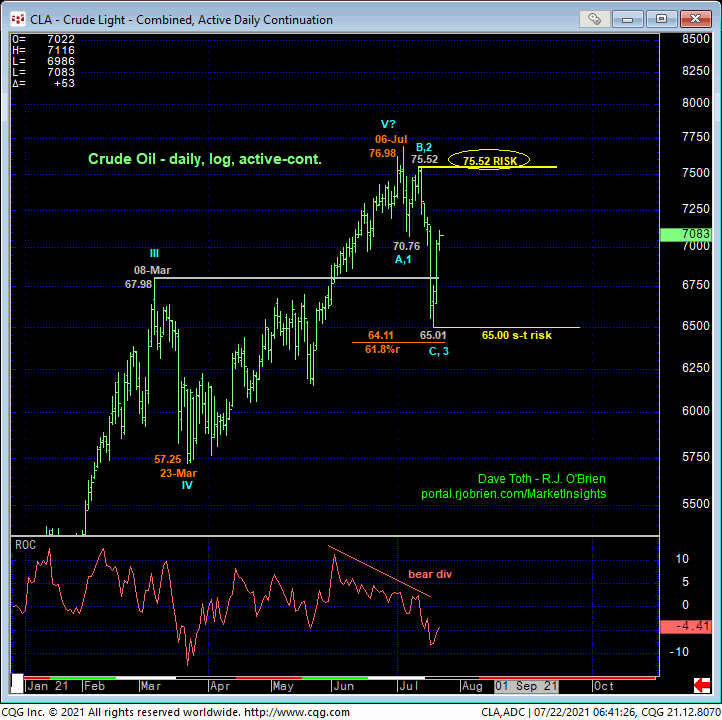
As with RBOB and diesel, 13-Jul’s 75.52 intra-day high fell short of 06-Jul’s 76.98 high. But since the market closed at a new high on 13-Jul at 75.25, we have to acknowledge the prospect that that day’s 75.52 intra-day high completed a 5th-Wave “failure” to a wave sequence up from 23-Mar’s 57.25 low. And if this is the case, mid-Jul’s sell-off would be only the initial A- or 1st-Wave of a larger-degree correction or reversal lower. And if this is the case, then we would expect a bearish divergence in short-term momentum to arrest this corrective recovery at some level shy of those 13-Jul highs.
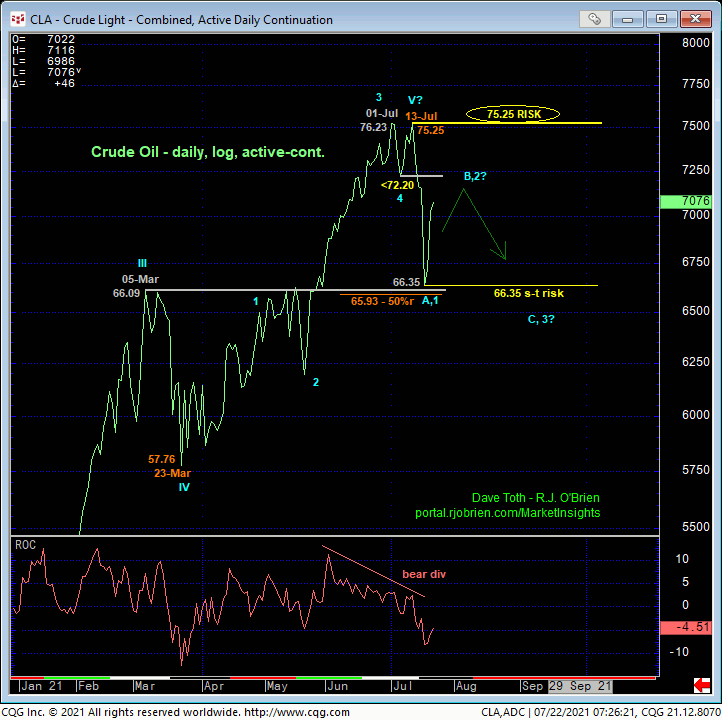
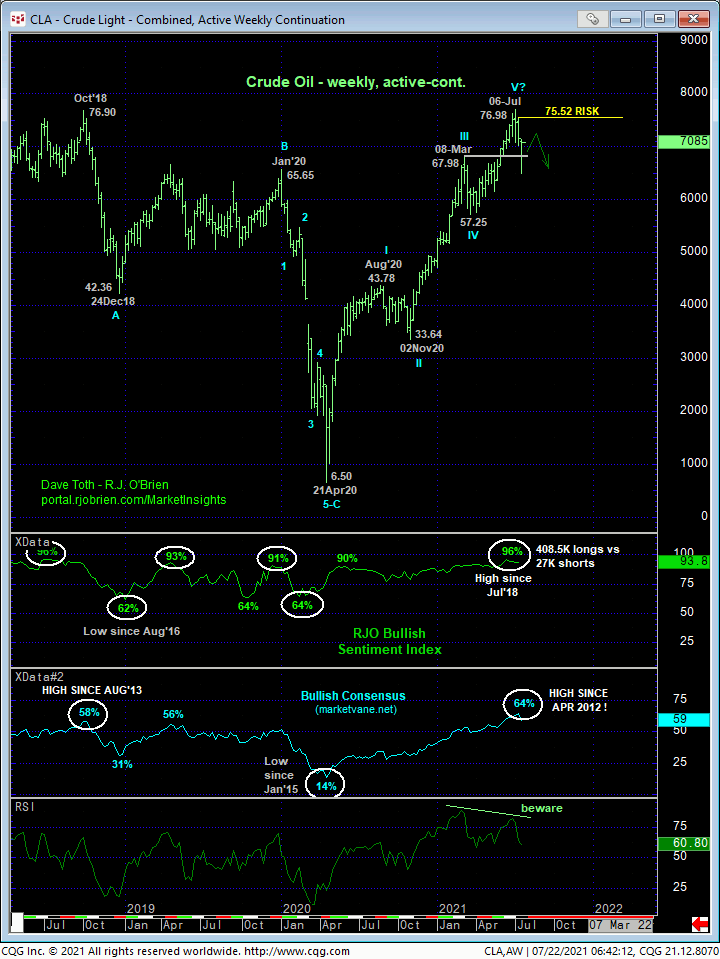
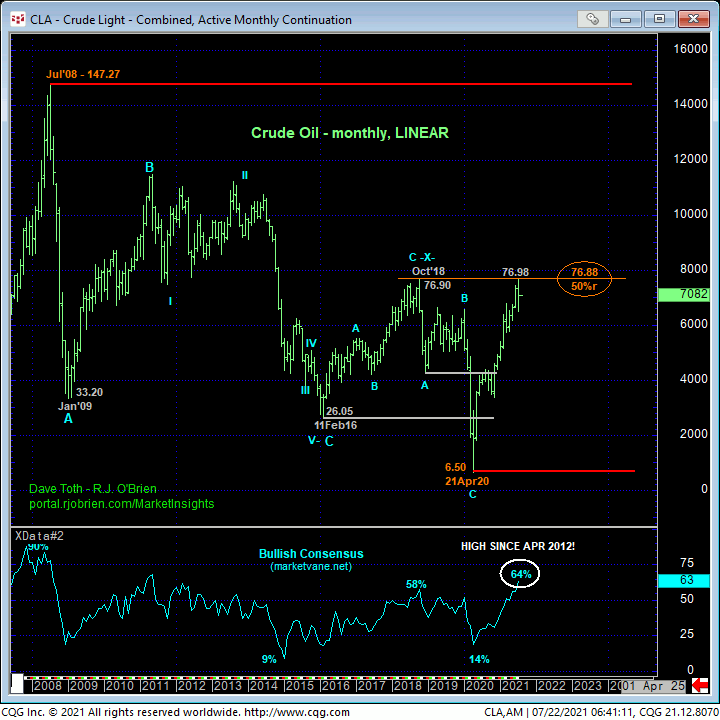
Here too, months of waning upside momentum amidst historically frothy sentiment levels are complicit in a broader peak/correction/reversal-threat environment. The market’s proximity to Oct’18’s 76.90 high/resistance and the (76.88) 61.8% retrace of the 12-YEAR secular bear trend from 147.27 to 6.50 on a monthly linear scale are also interesting and potentially reinforcing elements to such a count. If this count is wrong and mid-Jul’s sell-off completed another correction, all the bull has to do is resume the secular bull above 75.52. Until and unless such strength is proven, it’s not hard to question the risk/reward merits of a bullish policy from 70.00+ levels.
These issues considered, a neutral/sideline policy is advised for the time being with a bearish divergence in short-term momentum in the days/week ahead presenting a favorable risk/reward opportunity from the bear side.
