AUG CRUDE OIL
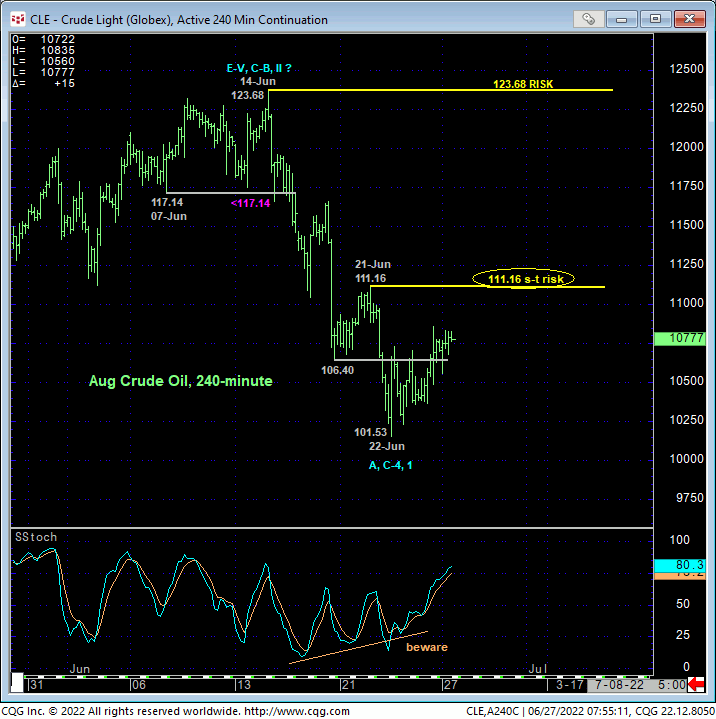
Since 14-Jun’s bearish divergence in very short-term momentum from the upper-quarter of the past quarter’s range discussed in 15-Jun’s Technical Blog, we’ve approached this market from the “non-bullish” side (as opposed to outright bearish) because the debate as to whether the price action from 07-Mar’s 130.50 high is merely consolidative (within the secular bull trend) OR that of a major peak/reversal process continues. The 240-min chart below shows the subsequent intra-range erosion and now the developing potential for a countering BULLISH divergence in short-term mo that, if confirmed above 21-Jun’s 111.16 smaller-degree corrective high and short-term risk parameter, will perpetuate the broader, lateral range, at least a corrective rebuttal to the recent setback and possibly a resumption of the secular bull. Until and unless the market recoups 111.16 and especially if the market relapses below last week’s 101.53 low, a more aggressive assault on the lower recesses of the 3-month range would be expected, and possibly a major reversal below 11-Apr’s 92.93 pivotal low. Per such, we’re defining 111.16 as our new short-term risk parameter from which non-bearish decisions like short-covers can be objectively based and managed.
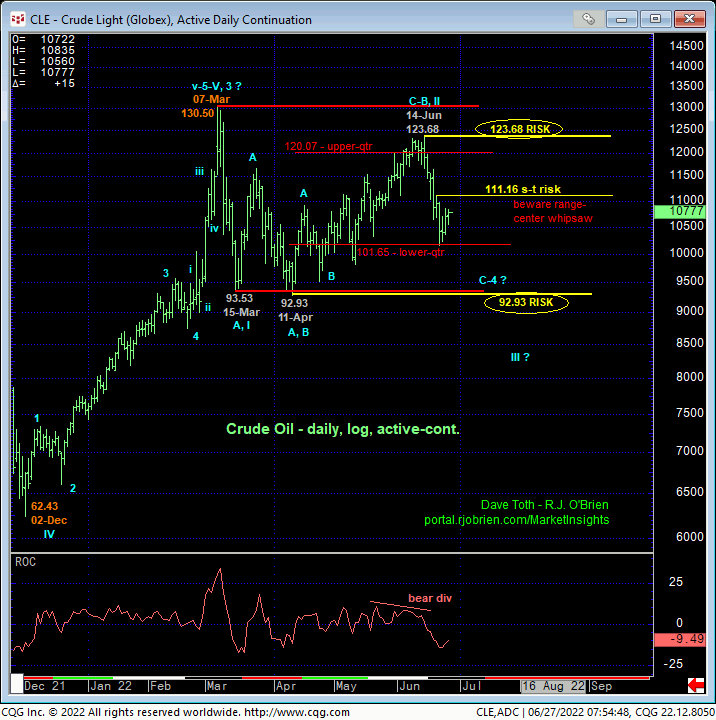
The daily log chart above shows the markets current position deep within the middle-half bowels of the past quarter’s range where the odds of aimless whipsaw risk are approached as higher. Under such range-center conditions where the risk/reward metrics of directional exposure are abhorrent, we urge a more conservative approach to risk assumption. Hence the importance of a tight but objective bear risk parameter at 111.16.
Per this lateral perspective in the daily chart above, it is easy to bias towards a count that suggests this merely lateral chop is (4th-Wave) corrective/consolidative ahead of an eventual (5th-Wave resumption of the secular bull trend to new highs above 07-Mar’s 130.50 high. A recovery above 14-Jun’s 123.68 high will all but confirm the bull’s resumption.
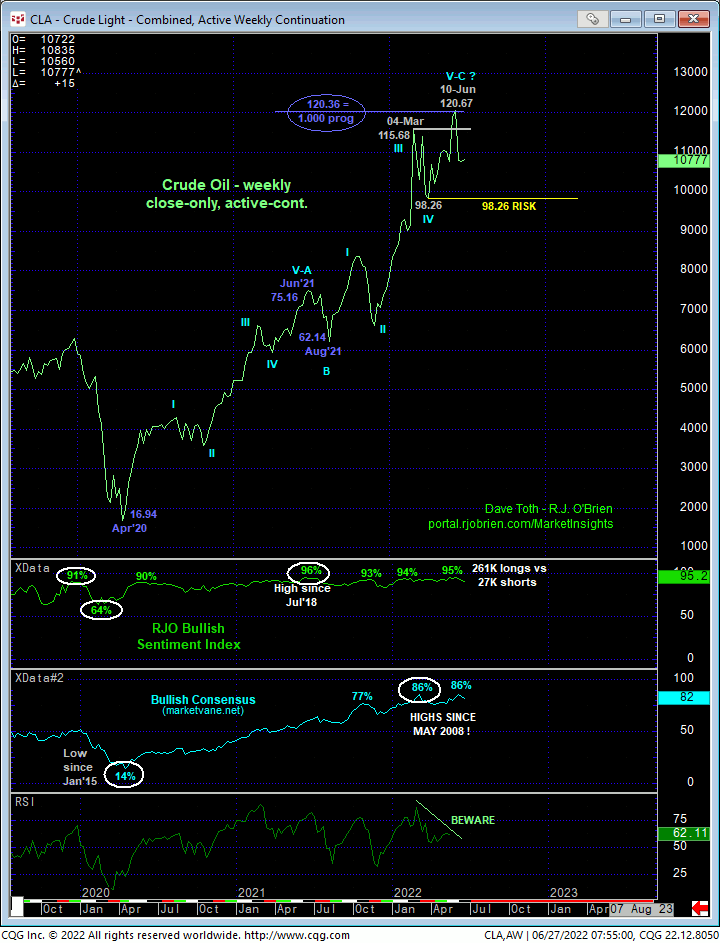
Alternatively, the weekly close-only chart below shows:
- waning upside momentum amidst
- historically frothy sentiment/contrary opinion levels and
- an
arguably complete 5-wave Elliott sequence from Aug’21’s 62.14 low given
10-Jun’s weekly CLOSE ABOVE 04-Mar’s 115.68 high in which
- the 5-wave sequence from Aug’21’s 62.14 low came within 30-CENTS of Apr’20 – Jun’21’s preceding 5-wave rally from 16.94 to 75.16.
This is a very interesting and compelling list of technical facts and observations that warns us to be alert to the prospect of a peak/reversal threat that we believe would be major in scope. A relapse below last week’s 101.53 would inch the market towards this peak/reversal count while a weekly close below 98.26 and/or an intra-week break below 11-Apr’s 92.93 intra-day low will confirm it. To negate this count, the market needs to recoup 123.68. The technical battle lines and key flexion points have been specified around which directional biases and exposure can be objectively toggled. While the market remains within the broader range, acknowledgement of and flexibility to either directional outcome is urged.
For the time being, a cautious bearish policy remains advised with a recovery above 111.16 required to negate this specific call, warrant its cover and move to a neutral/sideline position.
AUG HEATING OIL
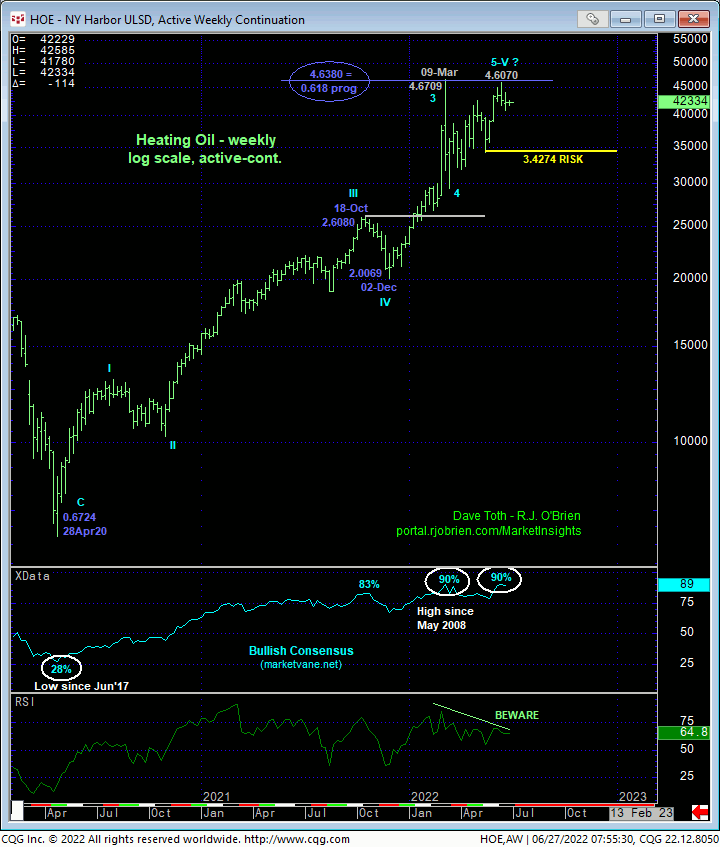
Given the correction-vs-reversal debate still raging in crude oil above, it is interesting to note the similar and unique combination of:
- waning upside momentum on a long-term weekly basis below amidst
- historically frothy levels in the Bullish Consensus (marketvane.net) measure of market sentiment/contrary opinion
- an
arguably complete or completing and massive 5-wave Elliott sequence up
from Apr’20’s 0.6724 low in which
- the completing 5th-wave from 02Dec21’s 2.0069 low has spanned a length 61.8% (i.e. 0.618 progression) of the net distance if Waves-1-thru-3 (0.6724 – 2.6080).
This compelling list aside, the market has yet to confirm a bearish divergence in momentum of a SCALE SUFFICIENT to break even the portion of the secular bull from 19-May’s 3.3578 larger-degree corrective low, let alone threaten the secular bull. Nonetheless, we have no doubt that these technical facts and observations are red flags that will eventually contribute to a peak/reversal environment that will be major in scope.
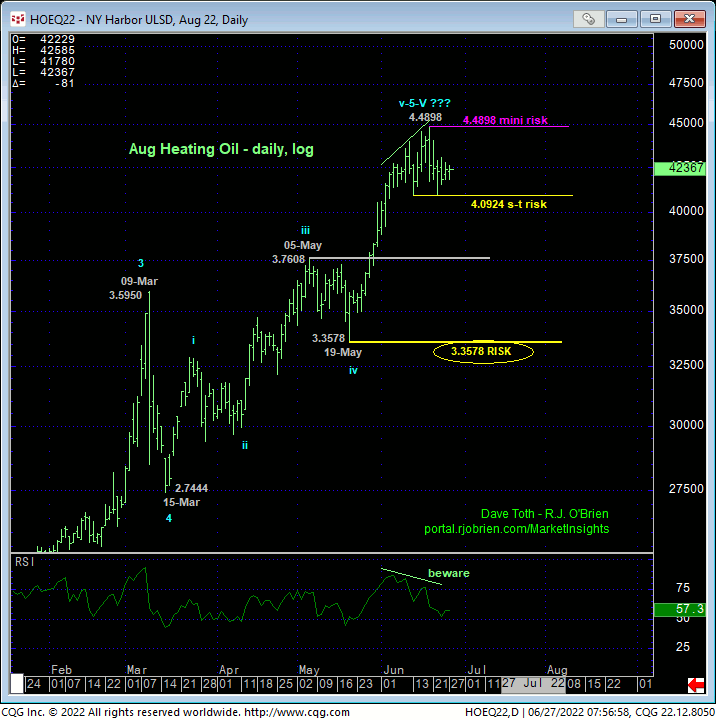
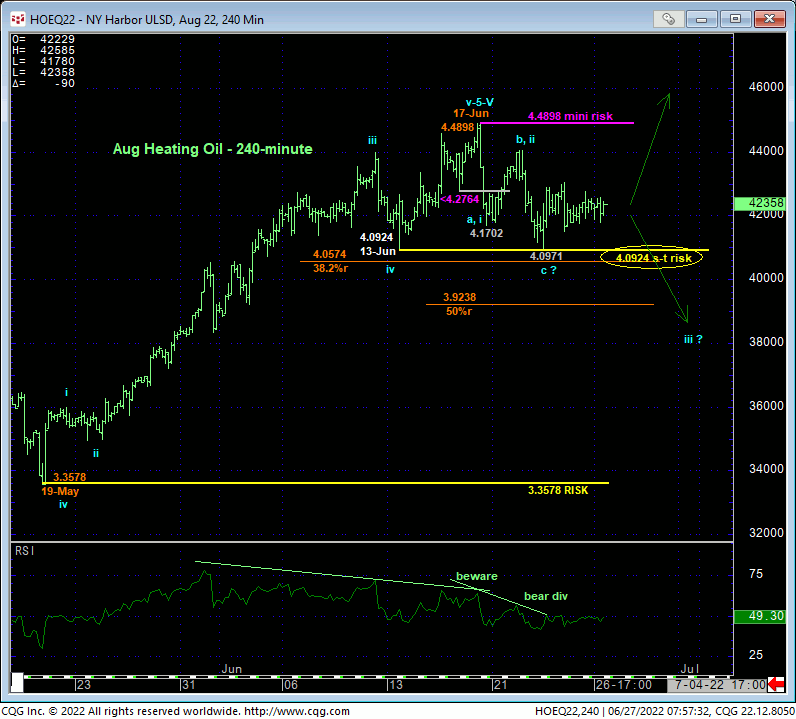
The daily log chart (above) shows the nicely-developing POTENTIAL for a bearish divergence in momentum. A failure below 13-Jun’s 4.0924 corrective low remains required to COFIRM this divergence to the point of non-bullish decisions like long-covers and bearish punts by most traders. On a scale sufficient enough to threaten the secular bull trend pertinent to long-term commercial players, this market needs to break 19-May’s 3.3578 larger-degree corrective low and key long-term bull risk parameter. This leaves lotta green between 4.0924 and 3.3578 where longer-term players will have the option of paring or neutralizing bullish exposure on a failure below 4.0924 and acknowledge and accept whipsaw risk, back above 4.4898, for much deeper nominal risk below 3.3578.
From an even shorter-term perspective however and as discussed in 17-Jun’s Technical Webcast, that day’s bearish divergence in very short-term momentum below 4.2764 leaves 17-Jun’s 4.4898 high in its wake as one of developing importance and a mini risk parameter from which very short-term traders with tighter risk profiles have been advised to move to a neutral-to-cautiously-bearish stance. Obviously, a recovery above 4.4898 will nullify this call and reinstate the secular bull marker warranting a reversal back into a cautious bullish policy for anyone who took interim non-bearish steps. By the same token however, the next level or scale of weakness below 4.0924 will obviously reinforce 17-Jun’s mo failure and that 4.4898 high, resistance and bear risk parameter.
These issues considered, traders are advised to toggle directional biases and exposure around 4.4898 and 4.0924 commensurate with their personal risk profiles.
AUG RBOB
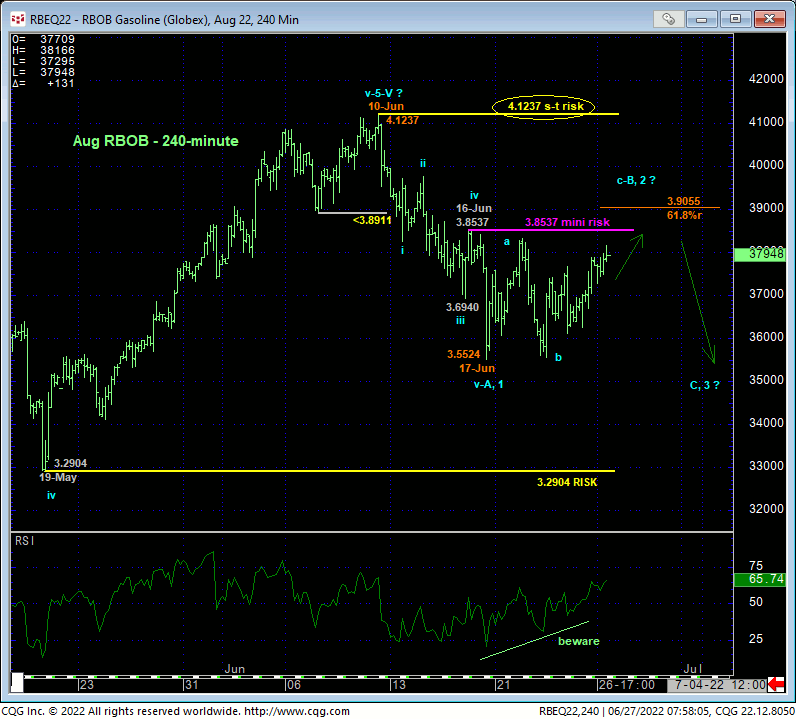
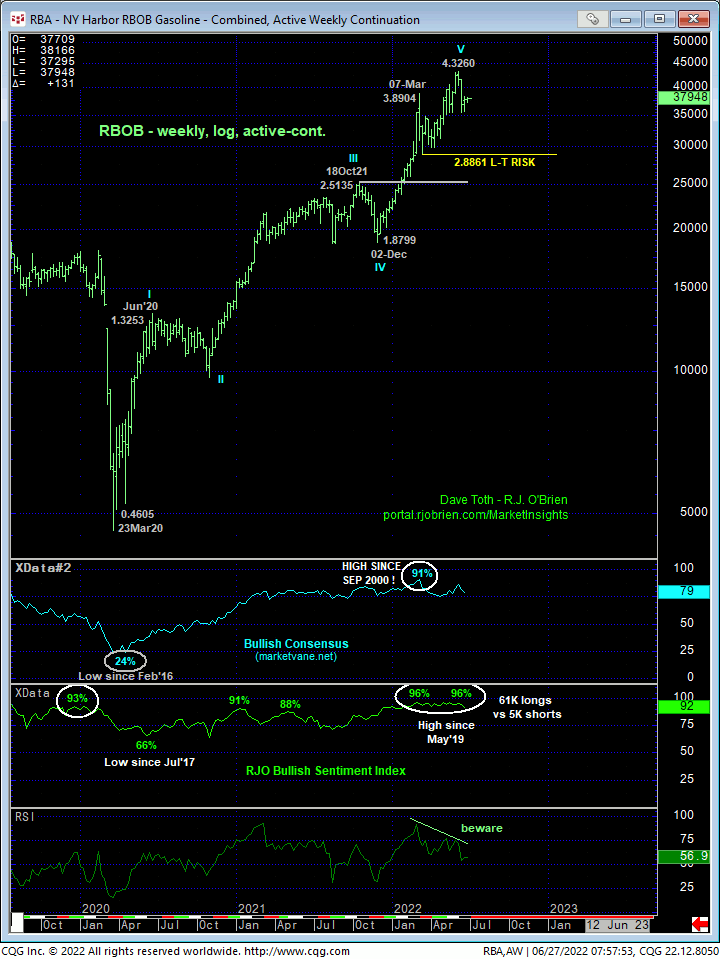
The technical construct and expectations for the RBOB market are identical to those detailed above in diesel with the key technical flexion points at 3.8537, 4.1237 and 3.2904 labeled in the 240-min chart above and daily log close-only chart below. Here too, the market has clearly exhibited shorter-term weakness that, to this point, remains well within the bounds of another mere correction within the secular bull trend, so the correction-vs-reversal debate and challenge rages on here as well. Traders are urged to acknowledge and be flexible to either directional outcome and toggled biases and exposure around these specific levels commensurate with their personal risk profiles.

From a long-term perspective, the weekly log chart below shows identical momentum, sentiment and wave elements that warn of an eventual major top similar to those discussed above in crude and heating oil. We believe this major top is coming and may already be here, but the market simply hasn’t provided the larger-degree evidence to conclude such at this time. As always, there is no objective way to conclude a major top from proof of only short-term weakness. We will certainly keep customers apprised of price action that reinforces either a peak/reversal count or continuation of the secular bull.
