SEP EURO
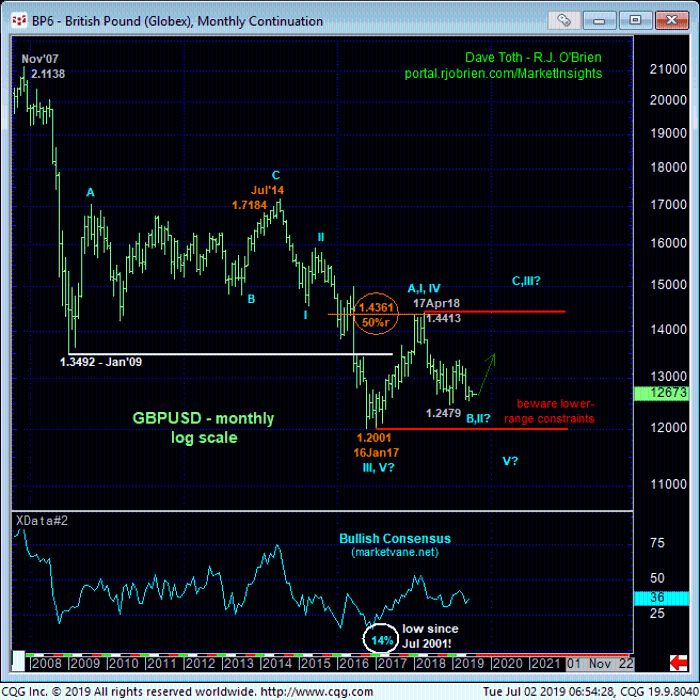
Yesterday’s break below last Thur’s 1.1418 initial counter-trend low reinforces the initial peak/reversal threat discussed in 25-Jun’s Technical Webcast that identified 25-Jun’s 1.1486 high as one of developing importance. Yesterday’s resumed weakness leaves Fri’s 1.1464 high in its wake as the latest smaller-degree corrective high this market is now required to sustain losses below to maintain a more immediate bearish count. A recovery above 1.1464 will render the sell-off attempt from 25-Jun’s 1.1486 high a 3-wave and thus corrective affair that would reinforce our broader base/reversal count. Per such this 1.1464 high serves well as our new short-term risk parameter from which traders can objectively rebase and manage non-bullish decisions like long-covers and cautious bearish punts.
Former 1.1420-area support is considered new near-term resistance.
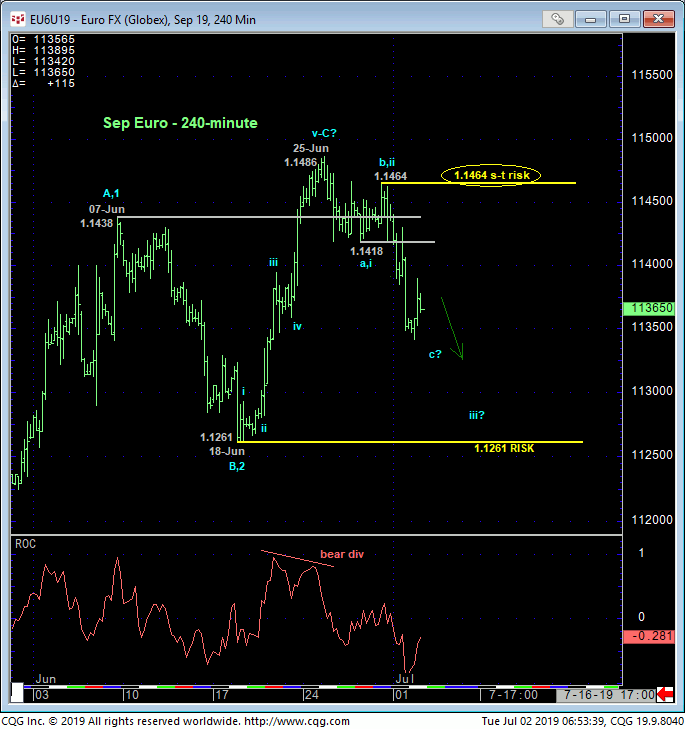
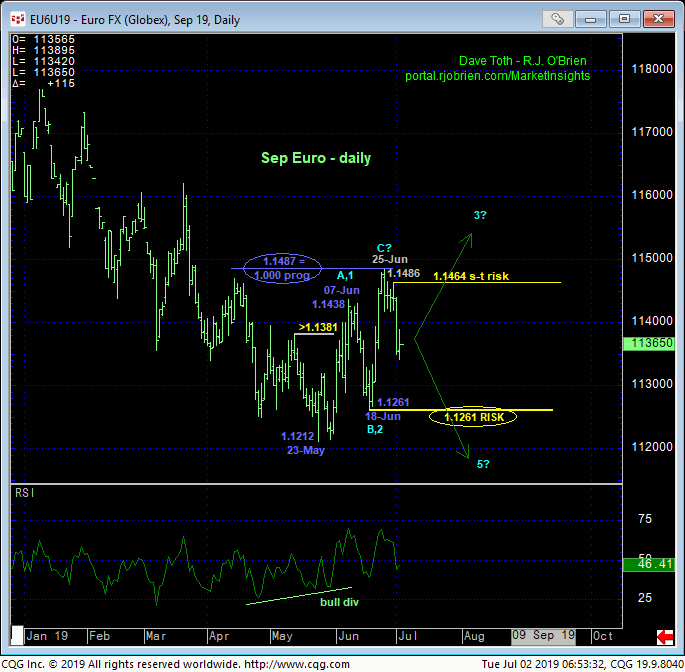
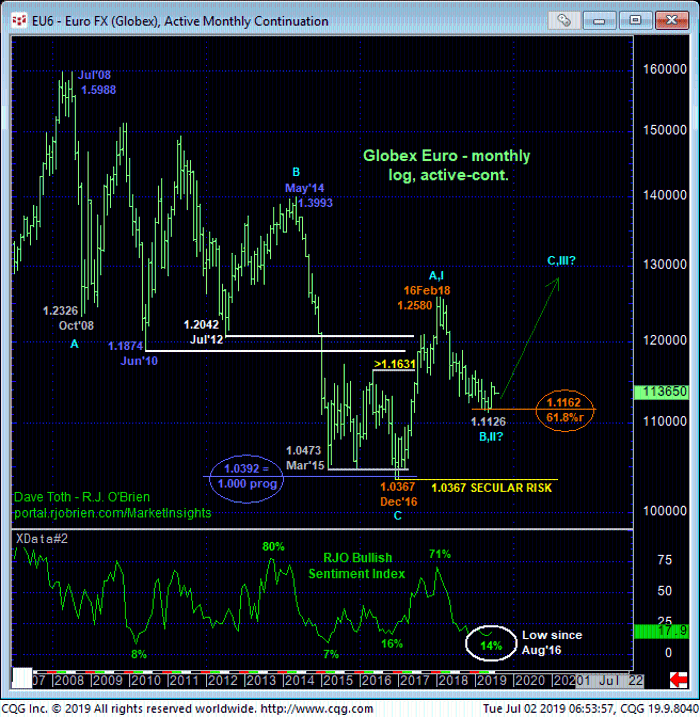
While the short-term trend is easily seen as down, the debate rages on as to whether the recovery from 23-May’s 1.1212 low in the Sep contract (and 1.1126 low in the then-prompt Jun contract shown in the weekly log chart below) is the start of a major base/reversal process or merely another correction ahead of a resumption of the downtrend from Feb’18’s 1.2580 high. TO THIS POINT the recovery from 23-May’s 1.1212 low in the Sep contract in the daily chart above is only a 3-wave affair; an arguably textbook one given the exact 1.000 progression of the initial 1.1212 – 1.1438 rally from 18-Jun’s 1.1261 low. Left unaltered by a recovery above at least our 1.1464 short-term risk parameter, this 3-wave recovery may be considered a corrective/consolidative structure that warns of a resumption of the major downtrend that preceded it.
PROOF of weakness below 18-Jun’s 1.1261 larger-degree corrective low and our key long-term risk parameter remains required however to CONFIRM May-Jun’s recovery as a bear market correction. Until and unless such sub-1.1261 weakness is proven, we cannot ignore the factors contributing to a BASE/reversal threat that could be major in scope:
- a confirmed bullish divergence in WEEKLY momentum amidst
- historically bearish sentiment/contrary opinion levels
- an arguably complete 3-wave correction of Dec’16 – Feb’18’s 1.0367 – 1.2580 rally that has thus far rejected
- a pair of Fibonacci retracement and progression relationships at 1.1162 and 1.1147 just pips away from May’s 1.1126 low.
We would also remind traders that from an even longer-term monthly log chart below, it’s easy to see how the extent and (5-wave) impulsiveness of Dec’16 – Feb’18’s rally threatens or breaks the secular bear market from Jul’08’s 1.5988 high to Dec’16’s 1.0367 low. This long-term bullish prospect contends that the rally to Feb’18’s 1.2580 high was just the initial (A- or 1st-Wave) rally of a major base/reversal process in which the relapse from that Feb’18 high would be considered the corrective B- or 2nd-Wave. And coming on the heels of a secular bear trend, a “more extensive” 61.8% retracement of that initial counter-trend rally is common.
IF the broader base/reversal count is correct and IF 23-May’s 1.1126 low completed the correction, then it’s incumbent on the bull to sustain trendy, impulsive price action UP above prior corrective lows like 1.1261. Its failure to do so will render the preceding recovery attempt a 3-wave corrective event consistent with a still-unfolding downtrend from Feb’18’s high. Herein lies the importance of 18-Jun’s 1.1261 low and key bull risk parameter as well as Fri’s 1.1464 short-term risk parameter, the recovery above which would confirm the latest setback as a corrective event within the still-developing broader uptrend.
In effect, we believe this market has identified 1.1261 and 1.1464 as the key directional triggers heading forward. Traders are advised to acknowledge and be flexible to both directional counts while this correction-vs-reversal debate continues. It will eventually be resolved and we’ll act accordingly bullish above 1.1464 and bearish below 1.1261. In the meantime, shorter-term traders with tighter risk profiles remain OK to maintain a cautious bearish policy with a recovery above 1.1464 negating this call and warranting its cover while a cautious bullish policy remains advised for long-term players with a failure below 1.1261 negating this call and warranting its cover. The market’s current position in the middle of these two flexion points does us no favors as the risk/reward merits of making a direction bet from the mid-1.13-handle are poor.
SEP BRITISH POUND
For the most part the technical construct and expectations for sterling are identical to those detailed above in the Euro. The EURGBP cross remains well within the bowels of a range that has been incessantly lateral for the past 2-1/2 years, so sterling likely isn’t going anywhere that the Euro isn’t.
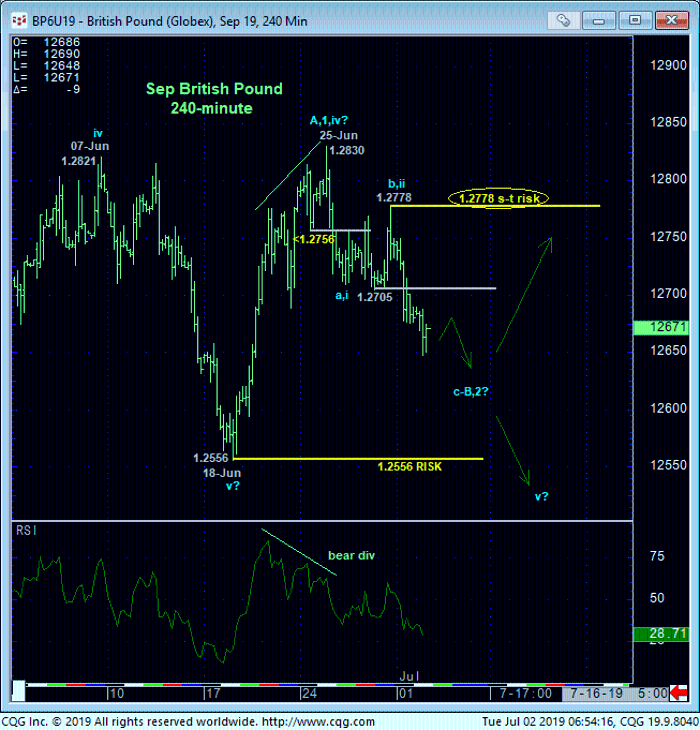
From a short-term perspective yesterday’s resumed relapse below last Thur’s 1.2705 initial counter-trend low reaffirms 25-Jun’s bearish divergence in short-term mo and leaves Fri’s 1.2778 high in its wake as the latest smaller-degree corrective high and new short-term risk parameter from which non-bullish decisions like long-covers and bearish punts can be objectively based and managed by shorter-term traders with tighter risk profiles.
A failure below 18-Jun’s 1.2556 low and key longer-term risk parameter remains required however to mitigate a broader base/reversal threat resulting from:
- a confirmed bullish divergence in momentum
- an arguably complete 5-wave Elliott sequence down from 13-Mar’s 1.3385 high
- the market’s rejection of the extreme lower recesses of the past YEAR’S range amidst
- historically bearish levels of market sentiment.
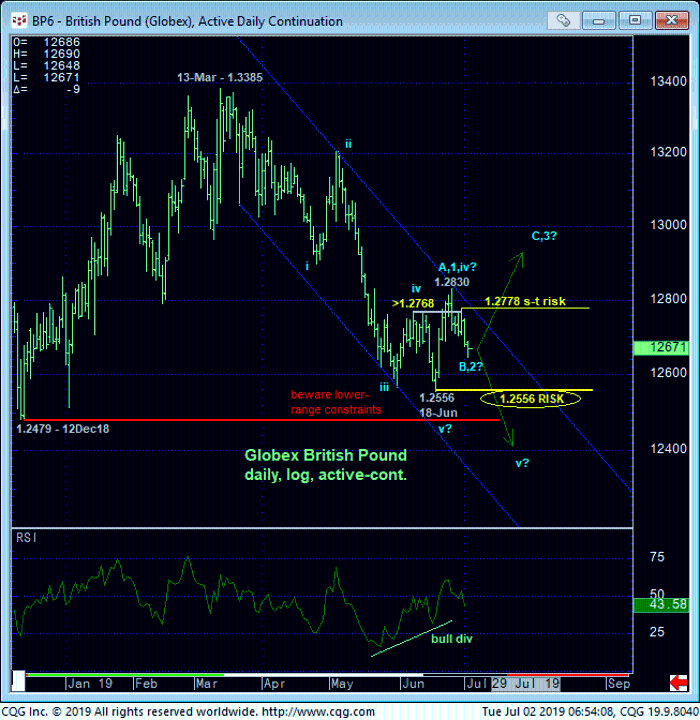

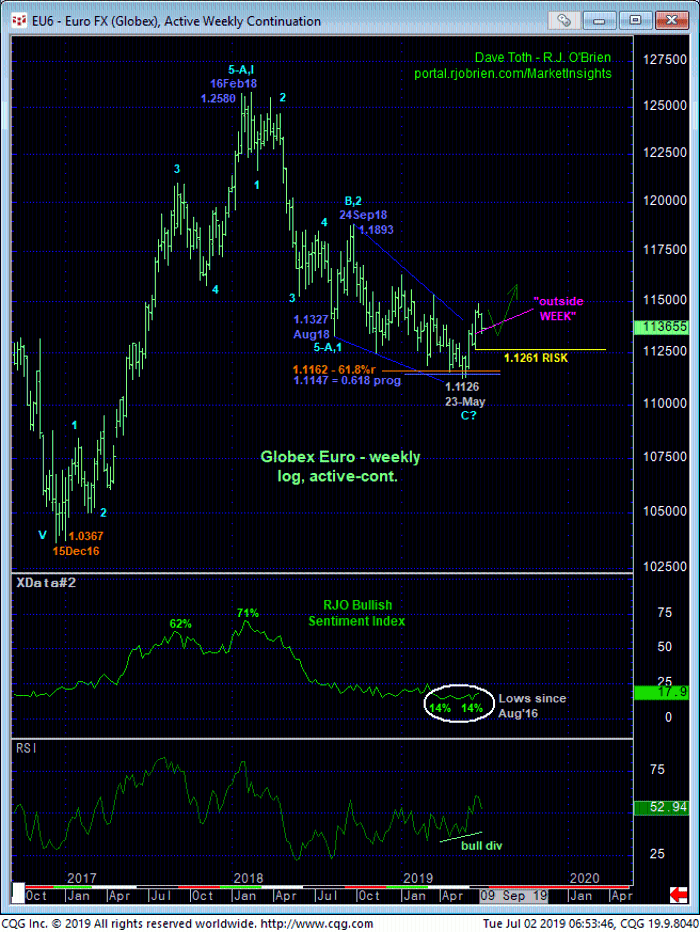
The monthly log chart below shows the market’s proximity to the lower-quarter of the past 2-1/2-YEAR range that poses a slippery slope for bears “down here” until and unless the market breaks 18-Jun’s 1.2556 low and key risk parameter.
These issues considered, a cautious bearish policy remains OK for shorter-term traders with a recovery above 1.2778 negating this call, warranting its cover and reinforcing a base/reversal count that could produce surprising gains in the months ahead. A cautious bullish policy remains advised for long-term players with a failure below 1.2556 negating this call, warranting its cover and resurrecting at least the past four months’ downtrend and possibly the major downtrend from Apr’18’s 1.4413 high.
