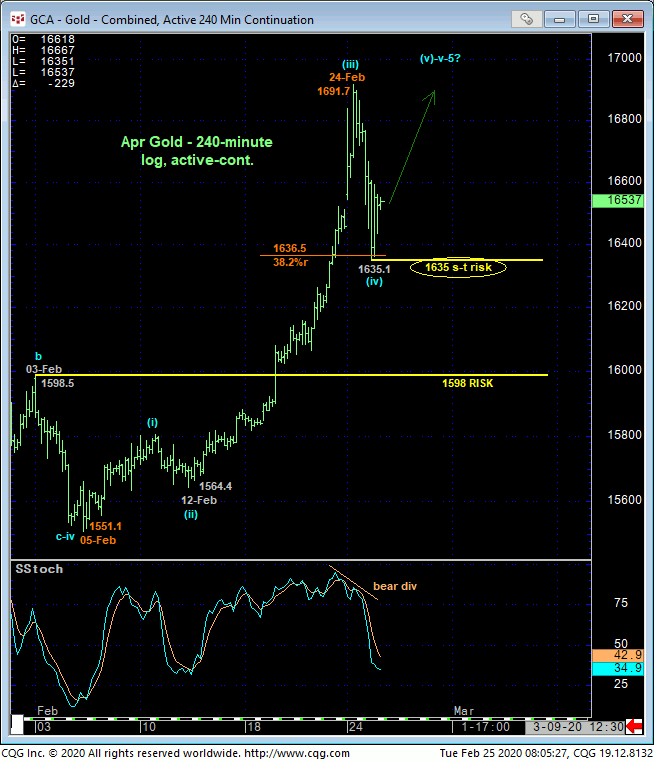
Given the exponential nature of last week and yesterday’s rally detailed in the 240-min chart below, we think it’s likely that the portion of the bull from 12-Feb’s 1564.4 low is just the 3rd-Wave of an eventual 5-wave sequence up from 5-Feb’s 1551.1 low. Per the count labeled below then, yesterday and overnight’s relapse to 1635.1 and 38.2% retrace of Feb’s 1551.1 – 1691.7 rally on a log scale is considered a 4th-Wave correction and potentially part of the slowdown process ahead of a final 5th-Wave rally to one more new high above 1691.7. Per such and given the huge gains recently achieved that would seem to warrant a tighter risk parameter, we’re identifying 1635 as our new short-term risk parameter from which shorter-term traders with tighter risk profiles can objectively rebase and manage the risk of a still-advised bullish policy.


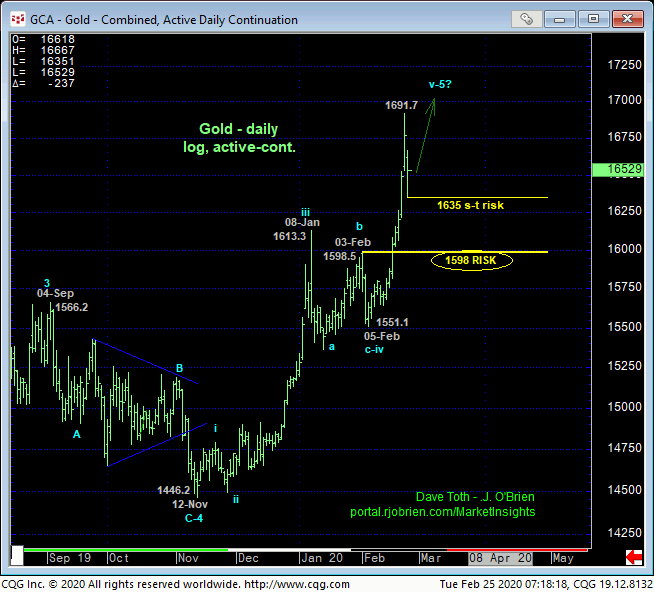
Taking a step back to consider the broader rally from 12Nov19’s 1446.2 low on a daily log scale basis above, it’s not hard to the prospect that this month’s portion of the bull from 05-Feb’s 1551.1 low is the completing 5th-Wave of this entire Nov-Feb sequence. However, a short-term failure below a very tight risk parameter like 1635 would not be a sufficient SCALE to conclude a top. Indeed, commensurately larger-degree weakness below at least former 1598-area resistance-turned-support from early-Feb should be required to threaten the secular bull trend.
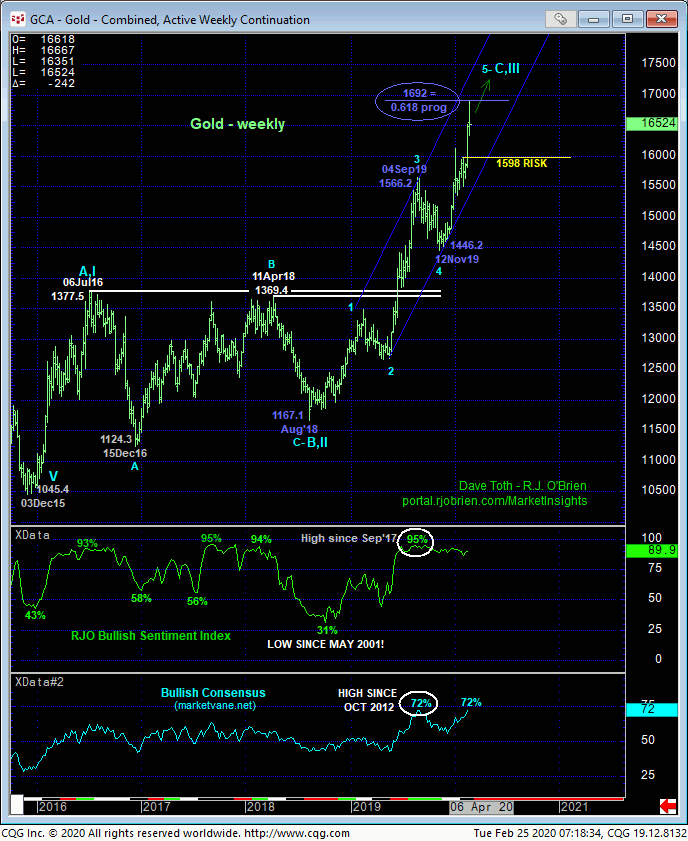
On an even broader weekly basis below, it’s very interesting to point out that the rally from Nov’s 1446.2 low is arguably the completing 5th-wave of a massive 5-wave Elliott sequence that dates from Aug’18’s 1167.1 low. Adding intrigue to this completing wave count is the Fibonacci fact that the suspected 5th-Wave up from 1446.2 has thus far come within a mere $0.30-cents of its (1692) 0.618 progression of the net distance of Waves-1-thru-3 (1167.1 – 1566.2). Amidst historically frothy levels of market sentiment/contrary opinion, these factors suggest that it’s not too early to be thinking about a prospective end to this mammoth bull and to keep a keen eye on momentum, and even short-term momentum like a failure below 1635.
Of course, until and unless the market either fails below a prior corrective low or an initial counter-trend low needed to CONFIRM a bearish divergence in momentum, we will anticipate further gains. We’re not in the business of bucking trends of any sort, let alone a secular bull behemoth.

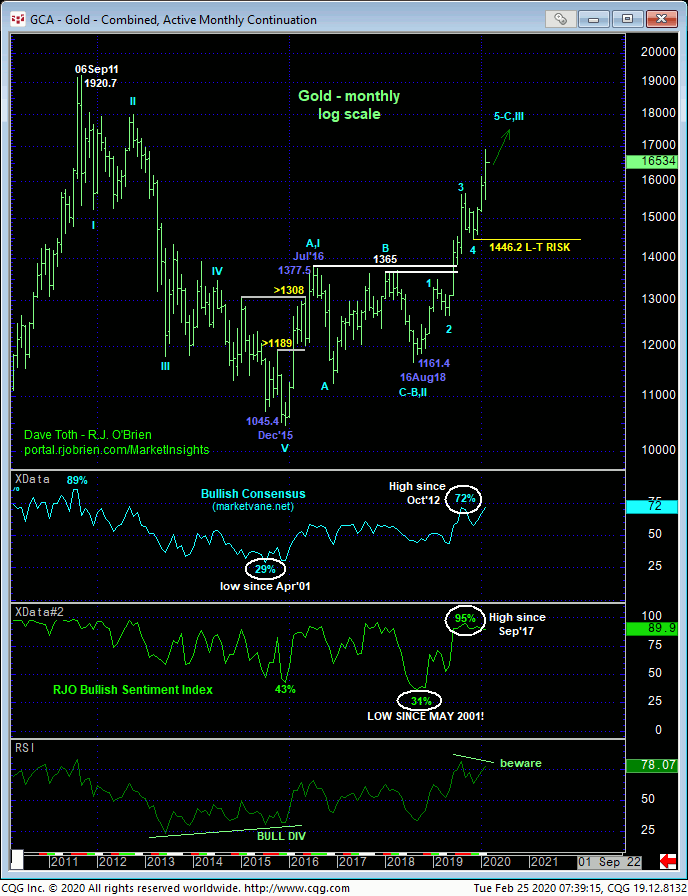
Lastly, the monthly log chart below shows the magnitude of the secular bull trend that’s now more than FOUR YEARS old and virtually no levels of any technical merit between spot and 2011’s 1920 all-time high (save for possibly yesterday’s 1691.7 high). In effect, there’s nothing to stop the bull currently, so all pertinent technical levels currently exists only below the market in the forms of corrective lows like 1635 and former resistance-turned-support like 1598. And until the market proves weakness below these levels, the trend’s continuance or acceleration should not surprise.
These issues considered, a bullish policy and exposure remain advised with a failure below 1635 sufficient to warrant paring or neutralizing bullish exposure by shorter-term traders. Commensurately larger-degree weakness below 1598 is required for long-term players to move to the sidelines. In lieu of such weakness, we anticipate at least one more round of new highs above 1691.7. But given the factors discussed above, traders are also urged to keep a close eye on momentum as this bull may be getting close to exhaustion.


