
Posted on Dec 14, 2022, 09:39 by Dave Toth
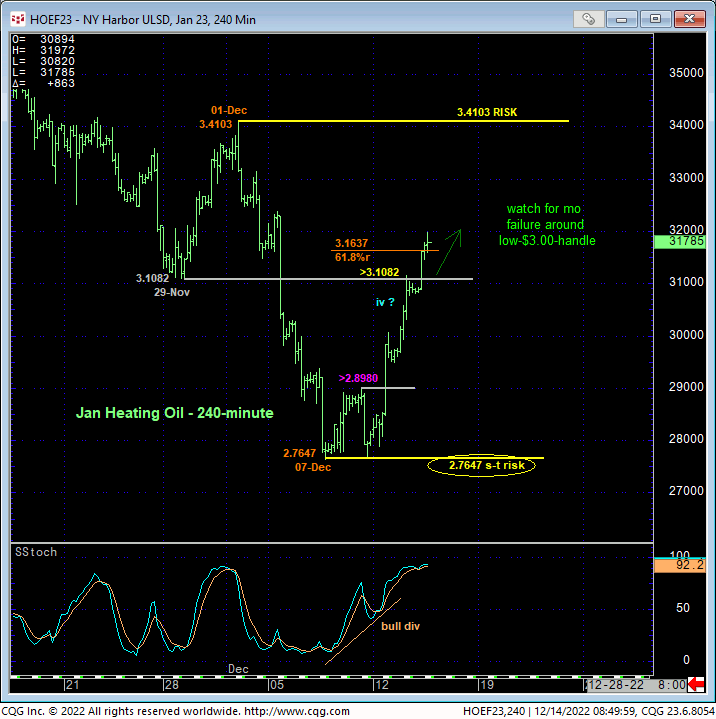
From a short-term perspective, the 240-min chart below shows overnight’s clear recovery above our short-term bear risk parameter defined by 29-Nov’s 3.1082 low, area of former support-turned-resistance and a suspected minor 1st-Wave low. By recovering above 3.1082, the market has nullified that count basis the JAN contract. Regardless of any geeky Elliott Wave considerations, it is clear that the market has identified 07-Dec’s 2.7647 low as one of developing, if shorter-term, importance and THE level this market now needs to break to confirm the current rebound as yet another correction within what we maintain is a major peak/reversal process from mid-Jun’s high.
While we’re looking at this intra-day chart, and for reasons we’ll expound on below, we advise traders to keep a keen eye on MOMENTUM as this market engages the lower-$3.00-handle-area. A countering bearish divergence in short-term mo from this area could be an early sign of a resumption of a broader bearish count.
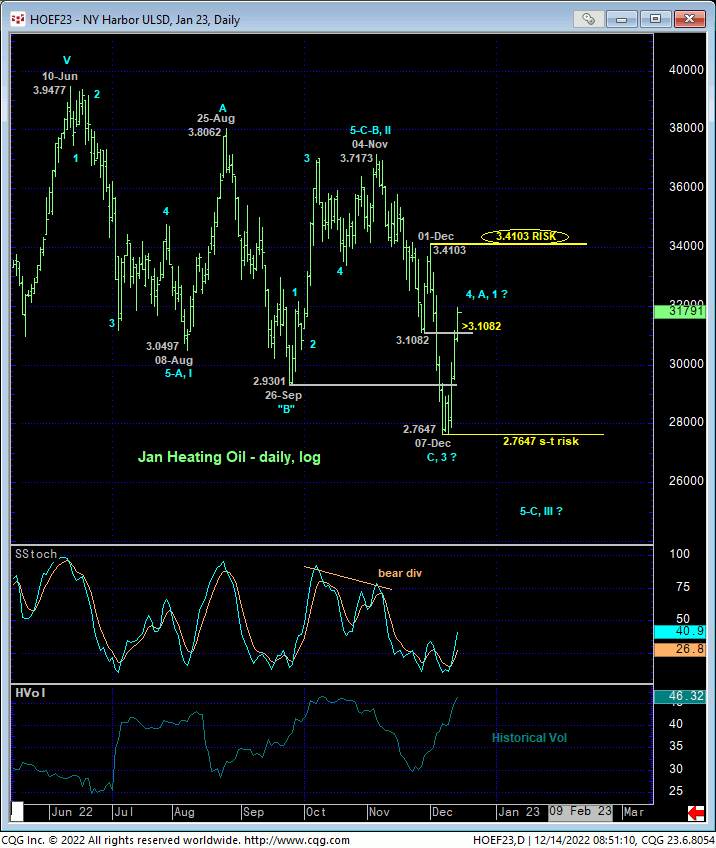
Stepping back a bit, the daily log scale chart of the JAN contract above shows the past few days’ relatively steep and violent rebuttal to Nov-Dec’s 25% decline from 3.7173 to 2.7647. Against the backdrop of the much broader 6-MONTH decline from 10-Jun’s 3.9477 high, this current recovery is thus far in keeping with previous volatile spikes in Sep-Nov and Aug that BOTH proved to be merely corrective within the multi-month peak/reversal process. As stated above on an intra-day basis, the extent of this week’s recovery above 3.1082 negates the specific impulsive integrity of our count that labeled that low a minor 1st-Wave. This hardly is sufficient however to conclude last week’s 2.7647 low as the end of the decline from 04-Nov’s 3.7173 high and start of the resumption of the secular bull market. Indeed, commensurately larger-degree strength above 01-Dec’s 3.4103 larger-degree corrective high remains required to, in fact, break even Nov-Dec’s downtrend, let alone conclude the end of the 6-month decline from Jun’s 3.9477 high. In effect, we’re saying that while this week’s recovery nullifies one specific wave count down from 04-Nov’s high, this recovery remains well within the bounds of a correction against the broader 6-month decline.
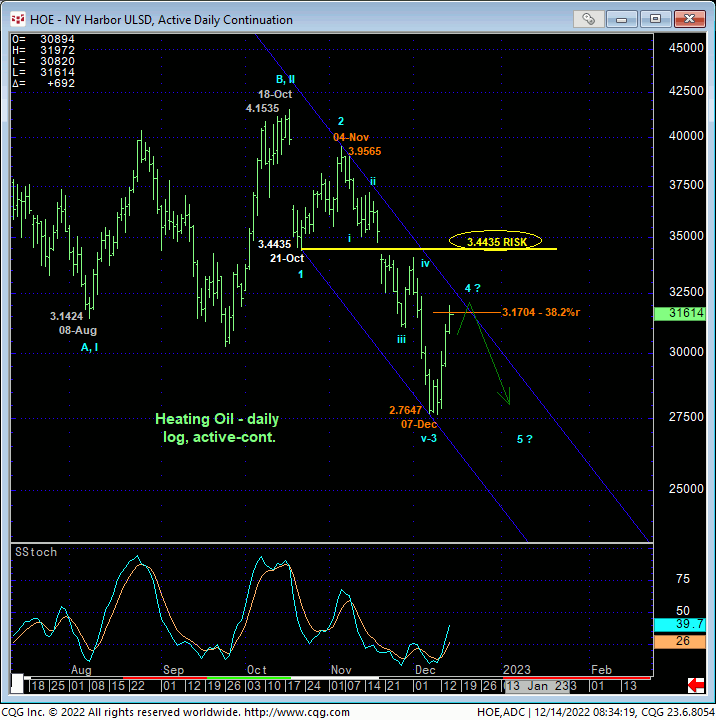
Such a bear market corrective count is easier to digest when looking at this market from an active-continuation perspective in the daily log chart below. Given the extent and magnitude of Nov-Dec’s decline from 3.9565 to 2.7647, this portion of the decline is easily considered the dramatic 3rd-Wave of an eventual suspected 5-wave sequence down from 18-Oct’s 4.1535 high. Against this backdrop, it follows that the current recovery attempt is a prospective 4th-Wave correction ahead of an eventual 5th-Wave down to new lows below 2.7647. And per this count, it may prove notable that the Fibonacci minimum 38.2% retrace of Nov-Dec’s 3.9565 – 2.7647 decline cuts across at the lower-$3.00-handle area around 3.1704. This is one reason why we advise traders to be on the lookout for a recovery-stemming bearish divergence in short-term mo from this area.
To negate this broader bearish count on this active-continuation basis, the market needs to recover above 21-Oct’s suspected 1st-Wave low at 3.4435.
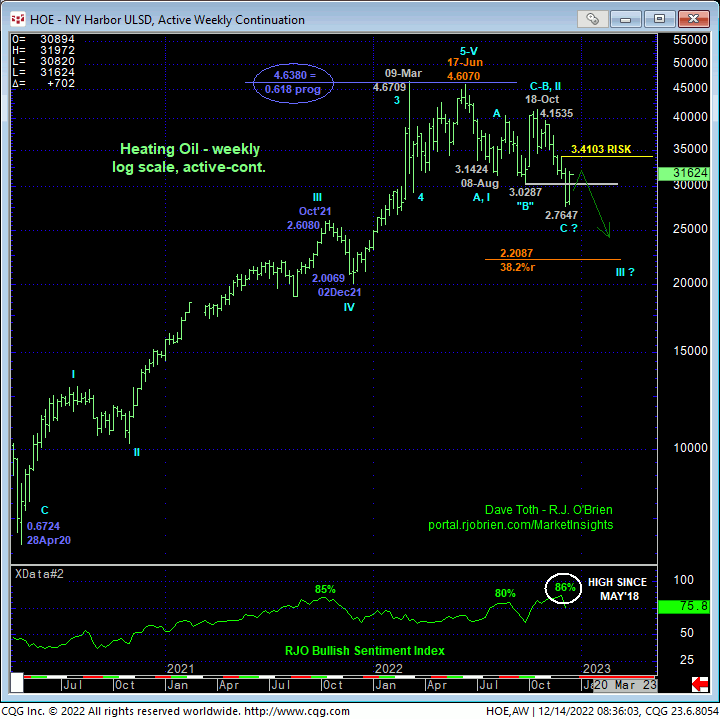
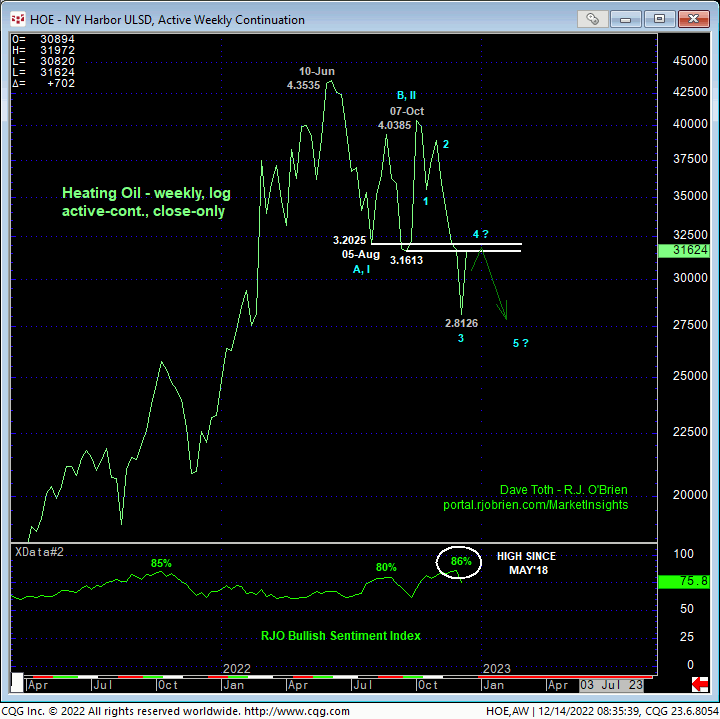
On an even broader weekly log active-continuation basis, the chart above shows the technical facts on which our long-term peak/reversal count is predicated:
- a confirmed bearish divergence in weekly momentum back in early-Jul amidst
- historically extreme bullish sentiment/contrary opinion
- a textbook complete and massive 5-wave Elliott sequence up from Apr’20’s 0.6724 low
- resumed decline last month that confirms Aug-Oct’s recovery attempt as a 3-wave and thus corrective event.
The weekly log active-continuation close-only chart below cleans out a lot of intra-week noise and shows the lower-$3.00-handle-area around 3.16-to-3.20 as key former support that, since broken last week, serves as a new key resistance candidate. IF our bearish count is correct and IF the past week’s recovery is a 4th-wave correction, then we would expect this recovery to stall out somewhere in the vicinity of this former support around the lower-$3.00-handle-area. The early indication of such a stall-out would come from a bearish divergence in short-term momentum.
Perhaps another factor for the merits of considering an active-continuation chart in one’s analysis is the backwardation of the heating oil forward curve shown below. A year ago (light blue line), prices were not only lower, but the forward curve was relatively flat. Worldwide supply chain problems put a convenience premium on in-stock/in-warehouse supply. As each prompt contract month rolls to the next month, we will be seeing lower and lower prices until and unless this market negates the 6-month downtrend by recovering above commensurately larger-degree corrective highs and risk parameters like 01-Dec’s 3.4103 corrective high in the Jan contract and the analogous 3.3439 corrective high in the soon-to-be-prompt Feb contract.

Lastly and certainly not least, the monthly log active-continuation chart below shows not only the textbook complete 5-wave Elliott sequence from 2020’s 0.6724 low, but also this market’s gross failure to sustain new all-time highs above 2008’s previous all-time high at 4.1586. MINIMALLY, and along with the compelling list of peak/reversal facts bullet-pointed above, the risk/reward merits of a longer-term bullish policy “up here” are questionable. At most, these facts warn of a reversal lower that could be major in scope.
These issues considered, shorter-term traders have been advised to move to a neutral/sideline position in order to circumvent the heights unknown of a correction or reversal higher. we will be watchful for a countering bearish divergence in short-term mo from the lower-$3.00-handle-area arrest this recovery and reject/define a more reliable high and risk parameter from which to reconsider a resumed bearish policy. long-term commercial players remain advised to maintain a bearish policy with a recovery above 3.4103 required to negate this call and warrant its cover. In effect, we believe the short-term trend is up within the still-arguable long-term downtrend.


