Posted on Mar 16, 2023, 07:45 by Dave Toth
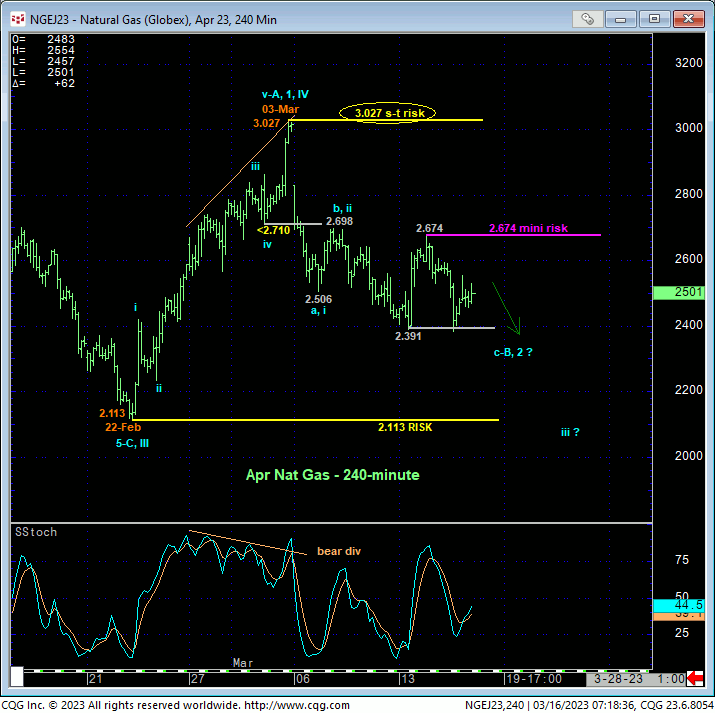
In 06-Mar’s Technical Blog, we discussed that day’s bearish divergence in short-term momentum that ended what we suspected and still suspect was just the initial A-Wave of a larger-degree bear market correction. The 240-min chart below shows yesterday’s continuation of this intra-range relapse below Mon’s 2.391 low that leaves Tue’s 2.674 high in its wake as the latest smaller-degree corrective high this market would be expected to sustain losses below if it’s got a more immediately bearish tack in mind. A recovery above 2.674 would break this month’s intra-range relapse, reinforce this ongoing corrective/consolidative count, and expose another recovery within this range that could take out 03-Mar’s obviously key 3.027 high. Per such, Tue’s 2.674 high is considered our new mini parameter from which traders can objectively manage the risk of non-bullish decisions like long-covers and cautious bearish punts.
Navigating such correction ranges is treacherous, challenging stuff that warrants a more conservative approach to directional risk assumption due to the greater odds of aimless whipsaw risk, especially from the middle-half bowels of a range in which this market currently resides. 22-Feb’s 2.113 low and 03-Mar’s 3.027 boundaries to the past month’s range are quite obvious as key directional flexion points. But using either of these levels as a risk parameter for directional exposure from current range-center price levels presents abhorrent risk/reward metrics. Herein lies the importance of an admittedly tight but objective short-term/mini bear risk parameter at 2.674.


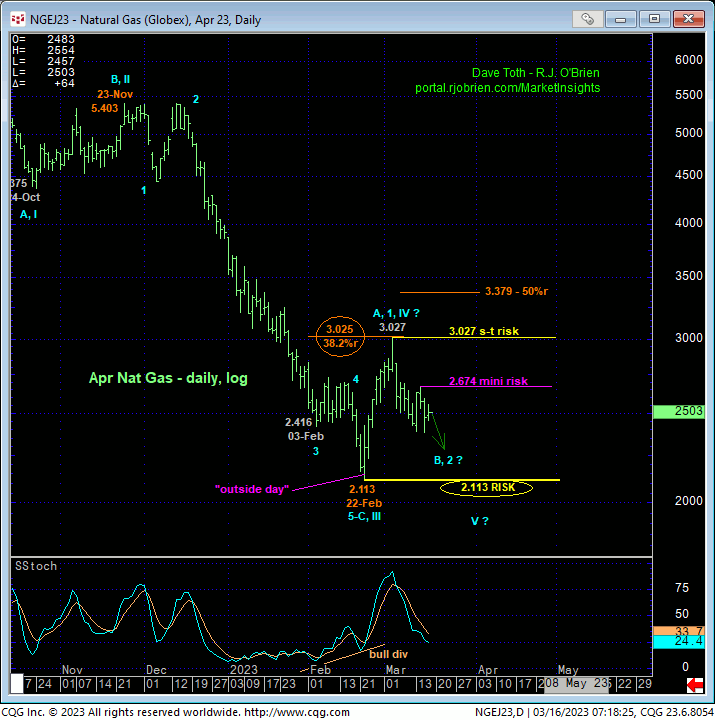
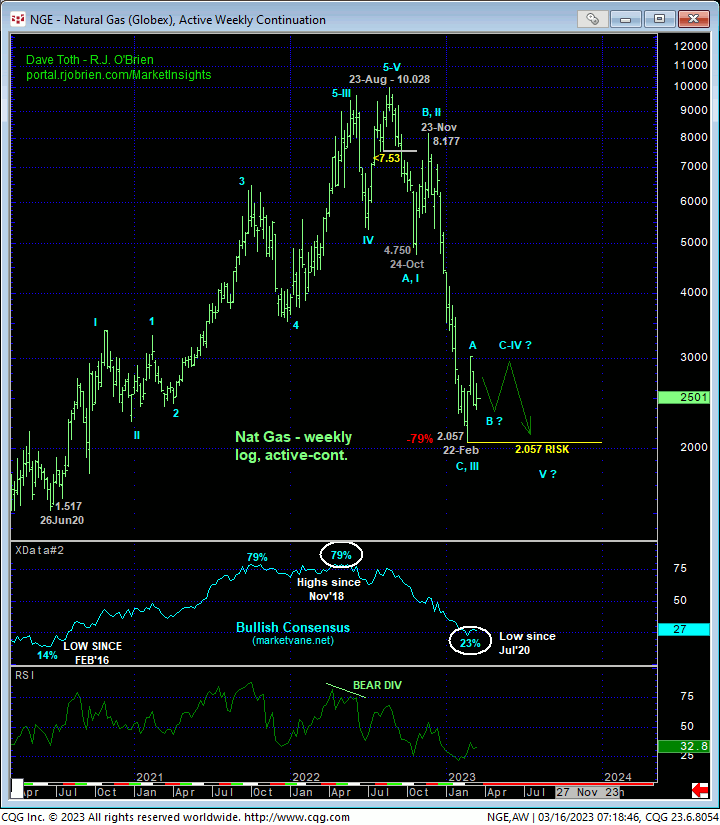
On a broader scale, we discussed in 28-Feb’s Technical Blog the END of a textbook 5-wave Elliott sequence down from 23-Nov’s 5.403 high that warned of a larger-degree (suspected 4th-Wave) correction/consolidation. Until/unless negated by a resumed (5th-Wave) downtrend below 22-Feb’s 2.113 low, this (4th-Wave) correction/consolidation remains arguably intact and can take on confusing, choppy, volatile, whipsaw characteristics that could span weeks more or even months. A recovery above 2.674 will reinforce this call and expose lateral-to-higher prices thereafter that could include a breakout above 03-Mar’s 3.027 high.

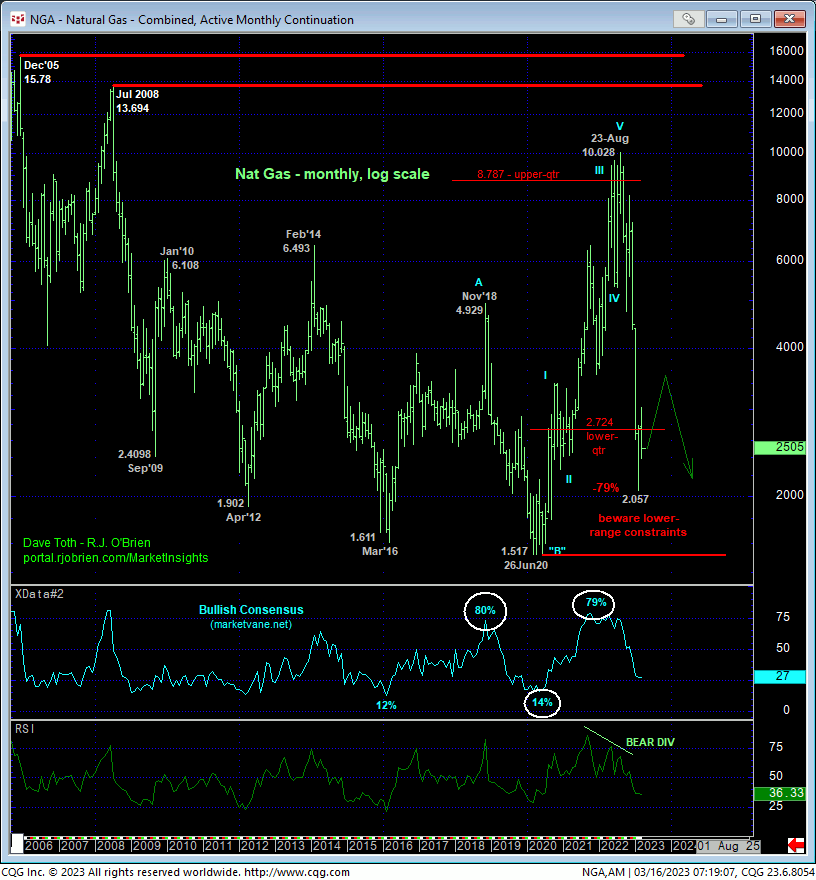
Contributing to this correction/slowdown of the major bear trend is the market’s foray into the lower-quarter of its massive bit lateral historical range shown in the monthly log chart below. This range between roughly 2.75 and 1.50 has repelled EVERY major bear trend since 2009 and will likely do so again. The challenge in navigating such a major base/reversal is that such bottoming PROCESSES can take MONTHS, even QUARTERS. As recently stated, the so-called “easy money” has been made with the trendiness of Nov-Feb’s meltdown. But this, frankly, easy trend only came after a slowdown/topping process that arguably began in MAY’22. That extraordinarily challenging down-up-down-up-down topping process that spanned SIX MONTHS was a trend-follower’s nightmare. THIS is the type of price action we anticipate in the two or three quarters ahead, only with respect to a bottoming process, before this current bear market ultimately bottoms out (probably) in the 2.00-to-1.50-range.
In the meantime and in sum, we’ve got the past month’s range between 2.113 and 3.027 to navigate, and we advise both short- and longer-term traders to toggle more conservative directional risk assumption around 2.674, being cautiously bearish below this level and neutral-to-cautiously-bullish above it.


