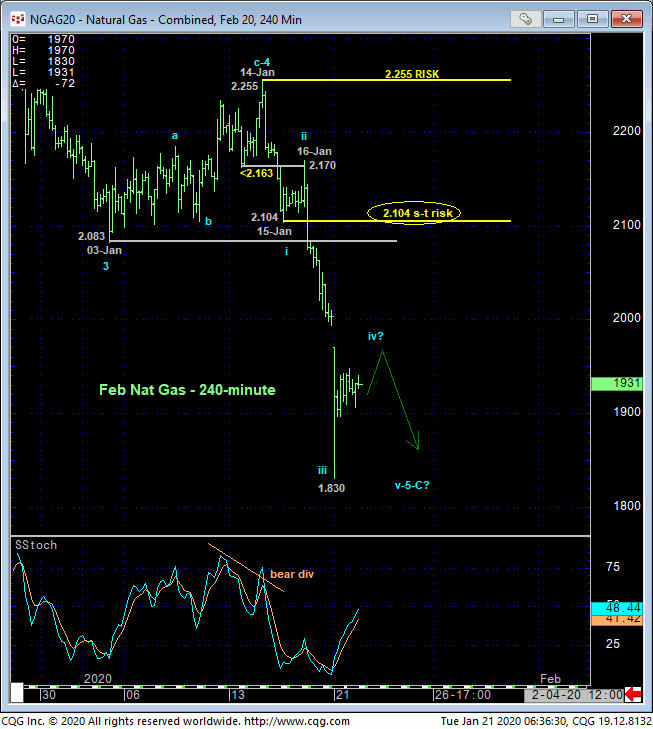
The 240-min chart below shows the 3rd-wave-type collapse from Fri into this week following 15-Jan’s bearish divergence in short-term momentum below our 2.163 short-term risk parameter and resumed bearish count discussed in Thur morning’s Technical Webcast. Of the supposed 5-wave decline from 14-Jan’s 2.255 larger-degree corrective high and key long-term risk parameter, it appears that the market has defined 15-Jsan’s 2.104 low as the 1st-Wave down of this sequence and a level the market should not be able to recover above per a continued bearish count. Per such, this 2.104 level becomes our new short-term risk parameter for the time being.
Given the accelerated, steep, 3rd-wave-nature of the plunge from Thur’s 2.170 high, we suspect the current rebound attempt from this week’s 1.830 low is a 4th-Wave correction ahead of at least one more (5th-Wave) sell-off attempt. Following such a relapse, we’ll be able to trail this short-term risk parameter to the high of this corrective rebound.


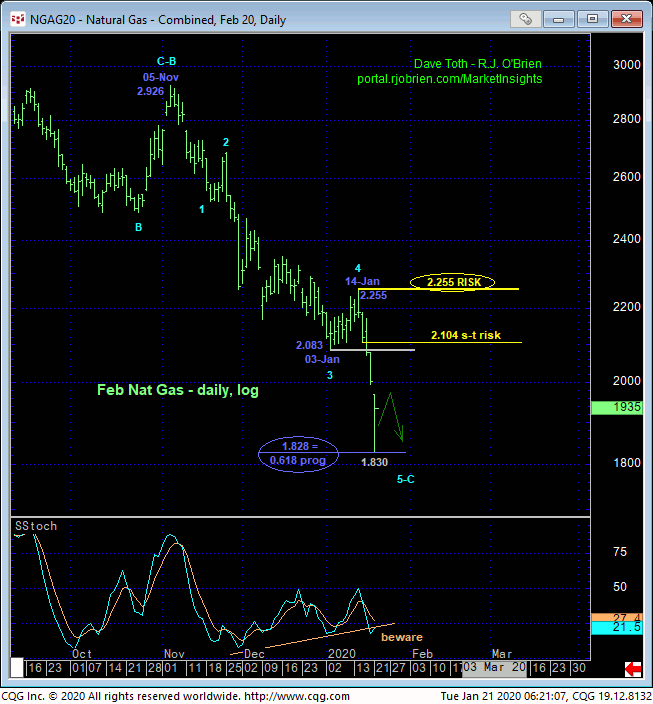
Stepping back to consider the broader bear trend from 05-Nov’s 2.926 high in the Feb contract, it’s clear and easy to see the importance of 14-Jan’s 2.255 next larger-degree corrective high as THE high and key risk parameter this market is required to recoup to, in fact, break the major downtrend and expose a base/reversal environment that, for even longer-term reasons we’ll discuss below, we believe could be major in scope. It is interesting to note however that the past week’s (suspected 5th-Wave) resumption of the bear from 14-Jan’s 2.255 high spanned a length exactly 61.8% of the length (i.e. 0.618 progression) of the net distance of suspected Waves-1-thru-3 from 2.926 to 03-Jan’s 2.083 low as labeled in the daily log scale chart above. As merely “derived” levels like Bollinger Bands, imokus, the ever-useless moving averages and even the vaunted Fibonacci relationships we cite often in our analysis have NEVER proven to be reliable reasons to identify support or resistance in the absence of an accompanying confirmed bullish (in this case) divergence in momentum, our technical focus is not on this interesting Fib relationship, but rather on 14-Jan’s 2.255 high.
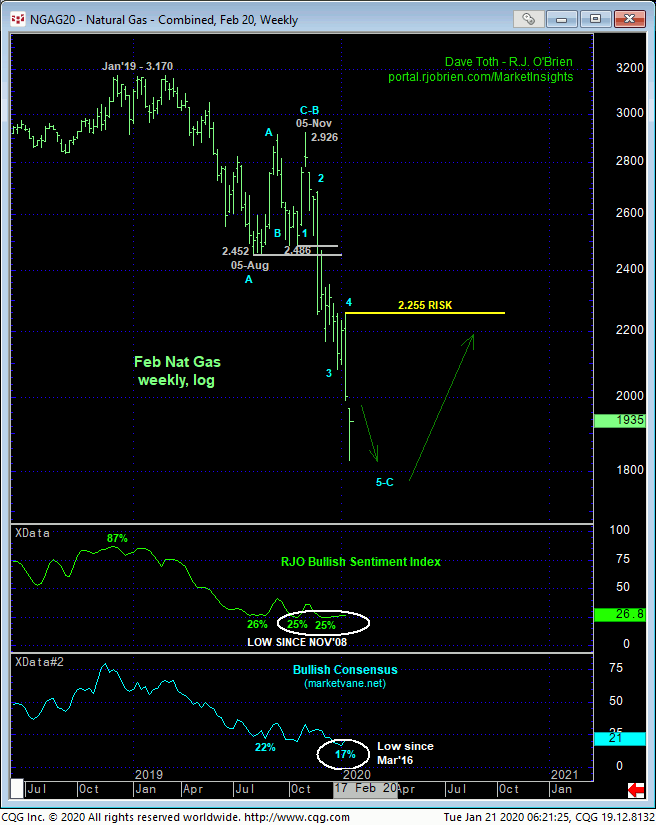
In addition to the prospect that the market could be completing a longer-term wave sequence down, the fact that the sentiment/contrary opinion indicators remain, understandably, at historically low levels is another warning flag regarding a base/reversal-threat environment that could be major in scope. This said, traders are reminded that sentiment is not an applicable technical tool in the absence of an accompanying confirmed bullish divergence in momentum. Here again lies the importance of 14-Jan’s 2.255 high and even 15-Jan’s 2.104 shorter-term risk parameter.
Indeed, if the past two days’ accelerated collapse is NOT a completing 5th-Wave, then the only thing it can be is a 3rd-wave. And in that case, this market shouldn’t come anywhere close to even former 208.-to-2.10-area support-turned-resistance, let alone that 2.255 larger-degree corrective high.

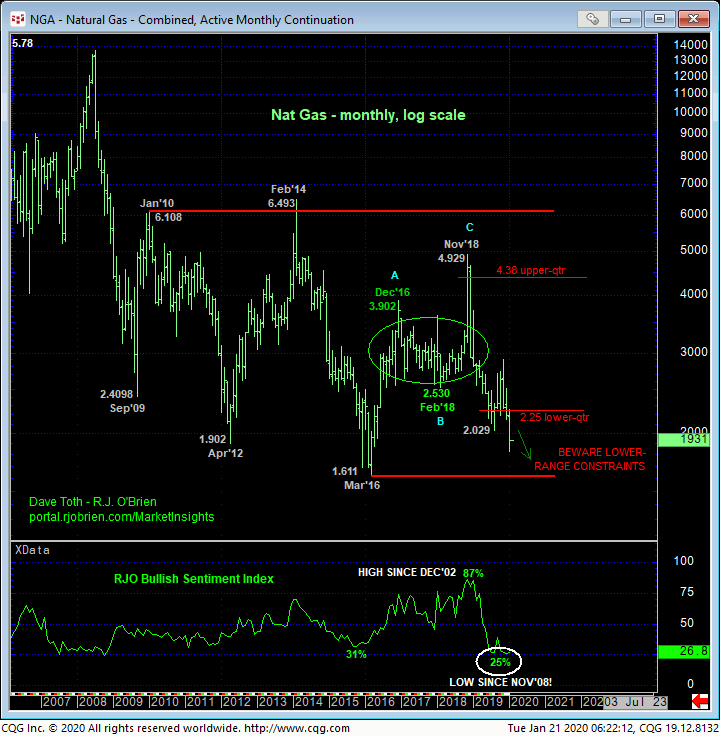
Finally, on an even longer-term, historic scale. the monthly log chart below shows the market pressing the extreme lower recesses of a massive 10-YEAR range that has repelled all sell-off attempts over this period. Combined with the wave and sentiment factors cited above, it’s easy to see the slippery slope bears are on “down here”.
To be sure, the trend remain down on all scales and warrants nothing less than a bearish policy and exposure. But to remain a favorable risk/reward bet down here around 1.94-area prices given the specific and objective risk parameters we’ve identified at 2.104 and especially 2.255, traders must expect continued weakness to at least Mar’16’s historic 1.61-area lows. Per such a count, continued proof of trendy, impulsive behavior lower is required. A bullish divergence in momentum, even on a smaller, intra-day scale, would be an early threat against the bear, and one that could easily morph into a base/reversal environment that, again, could be nothing short of major in scope. Until and unless the market threatens or stems this clear and present downtrend- and we will gauge this requirement specifically around 2.104 and especially 2.255- further and possibly severe losses should not surprise.
These issues considered, a bearish policy and exposure remain advised with a recovery above 2.104 required for shorter-term traders to move to the sidelines and longer-term players to pare exposure to more conservative levels. Commensurately larger-degree strength above 2.255 remains required to nullify any remaining bearish exposure and expose a base/reversal threat that we believe would be major in scope. In lieu of such strength, further losses towards Mar’16’s 1.611 major low should not surprise.


