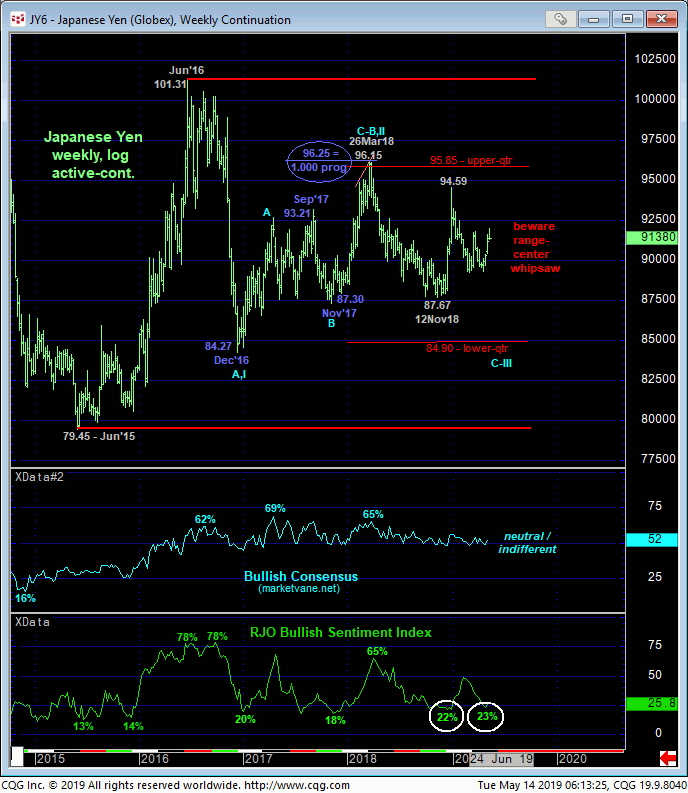
We’ve been kind of hands-off this market for a while because of its predicament of remaining caught in the middle-half bowels of an incessant THREE YEAR range where aimless whipsaw risk has made for very challenging trading and poor risk/reward merits on directional bets. This market simply has not been able to sustain a trend in either direction. But along with some compelling momentum, Fibonacci and Elliott Wave elements discussed below, we may be able to use this inability to sustain a trend to our favor in the days and perhaps even weeks directly ahead.


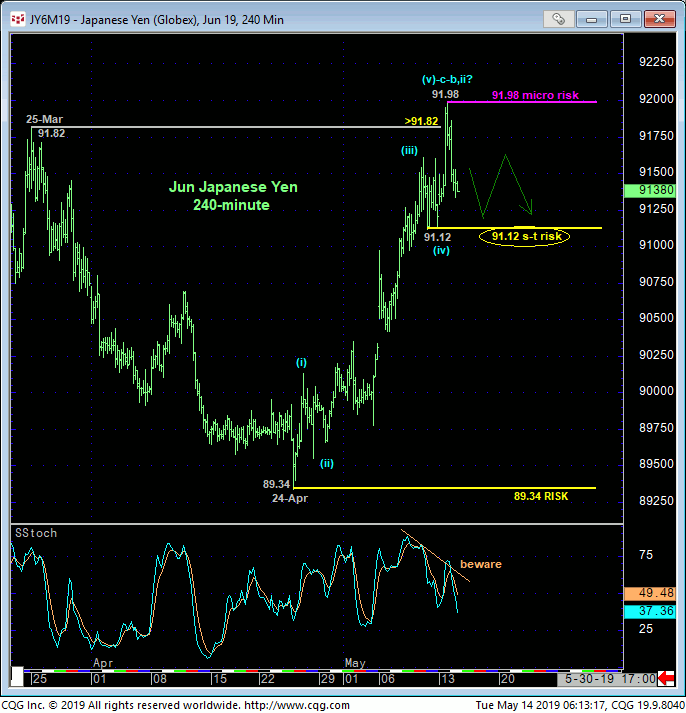
The 240-min chart above shows one of the better (up)trends of late. And again, this is a market that has NOT been able to sustain such trends within the bowels of the broader range, so especially with the nicely developing potential for a bearish divergence in short-term momentum, we’re suspicious that another intra-range trend reversal lies ahead.
Yesterday’s continuation of the recent rebound leaves Fri’s 91.12 low in its wake as the latest smaller-degree corrective low the market is now required to sustain gains above to maintain a more immediate bullish count. It’s failure to do so will CONFIRM the bearish divergence to the point of non-bullish action like long-covers and bearish punts. In this regard this 91.12 levels becomes our new short-term risk parameter from which BULLISH decisions can still be objectively based and managed.
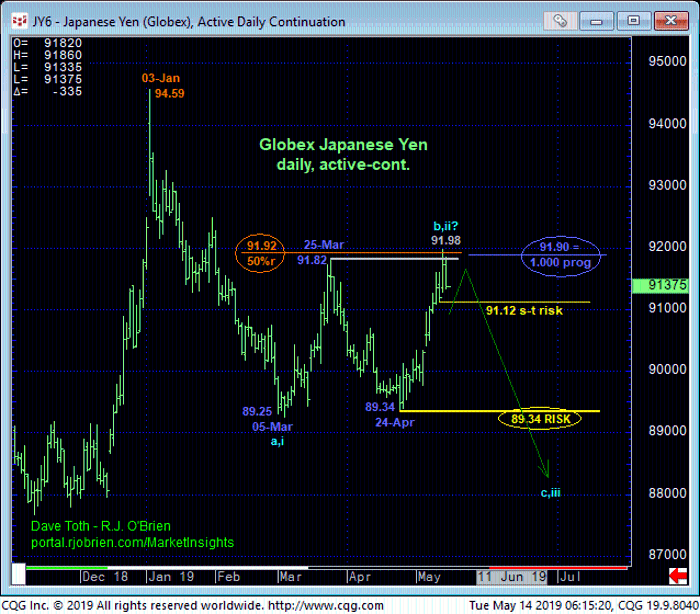
HOWEVER, the recent rally from 24-Apr’s 89.34 low is arguably a textbook 5-wave Elliott structure as labeled. This 5-wave rally is easily counted as the completing c-Wave of a broader (B- or 2nd-Wave) correction that dates from 05-Mar’s 89.25 low shown in the daily chart below. Indeed and to this point, the recovery attempt from that early-Mar low at 89.25 is clearly only a 3-wave and thus affair that, if correct, warns of a resumption of Jan-Mar’s downtrend that preceded it to new lows below 89.25.
Complicit with this intra-range bear market correction is that the recent rally thus far has stalled at a 91.98 level that is only pips away from the (91.92) 50% retrace of Jan-Mar’s 94.59 – 89.25 decline and its neighboring (91.90) 1.000 progression of Mar’s 89.25 – 91.82 initial counter-trend rally from 24-Apr’s 89.34 corrective low. COMBINED with the wave count proposed above and waning upside momentum, we believe a favorable risk/reward selling opportunity is presented with a recovery above yesterday’s 91.98 high and micro risk parameter required to negate this call and warrant its cover.
These issues considered and while we believe that there’ll be a minor corrective retest of yesterday’s high to the 91.60/.70-area that’d provide an even better risk/reward sale, traders are advised to establish cautious bearish exposure at-the-market (91.47) OB with a recovery above 91.98 required to negate this call and warrant its cover. Subsequent weakness below 91.12 will reinforce this count that warns of a potentially sharp drop in the weeks and even months ahead to sub-89.25 levels.


