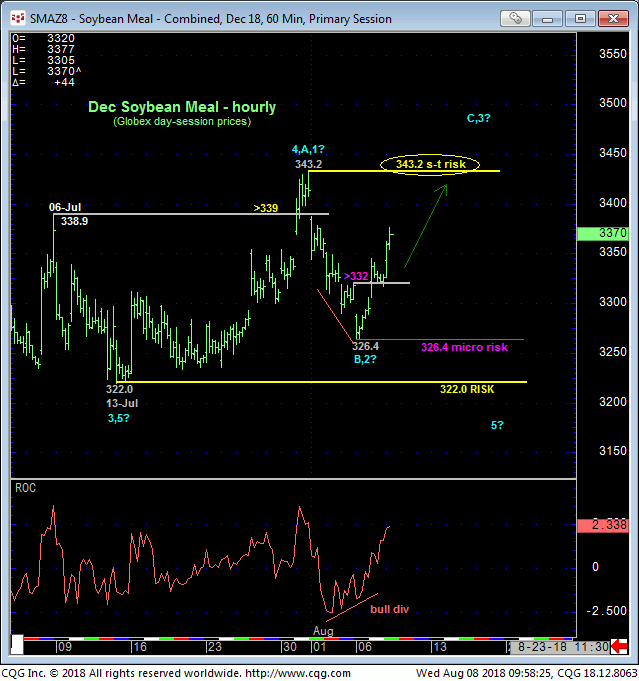
We’ve discussed some base/reversal-threat factors in our past couple blog updates that we’ll reiterate below. From a very short-term perspective, the market’s failure yesterday and today to sustain last week’s relapse below Fri’s 332 minor corrective high confirms a bullish divergence in very short-term momentum, defining Mon’s 326.4 low as one of developing importance and a micro risk parameter from which non-bearish decisions like short-covers and cautious bullish punts can be objectively based and managed.
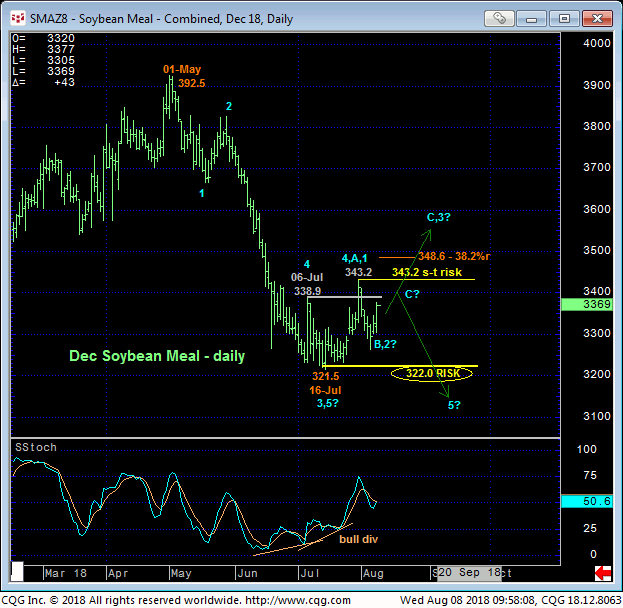
31-Jul’s 343.2 high and short-term risk parameter remains intact as a hurdle the market needs to break to reinforce a base/reversal count calling for a larger-degree correction or reversal higher. But the fact that the market has thus far survived a (potentially corrective) retest of 13-Jul’s key 322.0 low maintains the prospect for a larger-degree base/reversal count.


13-Jul’s 322.0 Globex day-session low was rendered relevant as a direct result of 31-Jul’s bullish divergence in daily momentum above. This divergence, in fact, breaks May-Jul’s downtrend, exposing EITHER a slightly larger-degree correction OR a more significant reversal higher. Both of these options remains as candidates until and unless the market relapses below 322.0.
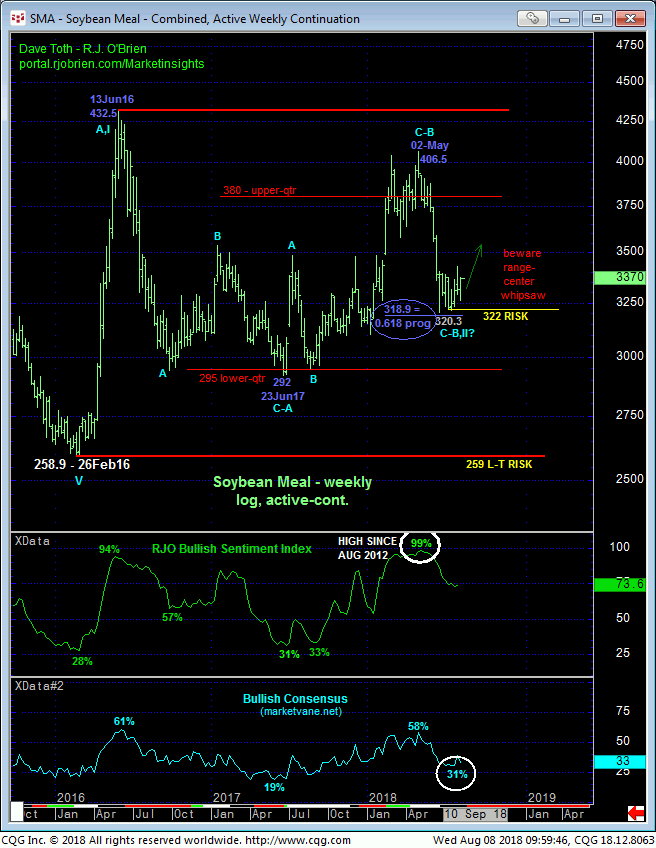
We’d be more constructive than we are if the past month’s basing behavior stemmed from the lower-quarter of the multi-year lateral range below around 295. The market’s position all year within the middle-half of this multi-year range has left it vulnerable to aimless whipsaw risk typical of such range-center conditions. It may prove important however that May-Jun’s sell-off attempt stalled within a couple bucks of its (318.9) 0.618 progression relationship to 2016-17s preceding 432 – 292 decline.
This relapse took the frothy-bullish edge off of our RJO Bullish Sentiment Index while it drove the Bullish Consensus (marketvane.net) to historically low levels typical of broader base/reversal-threat conditions. In the end we don’t believe current sentiment levels will prohibit either a broader move higher or resumption of this summer’s decline to new lows below 322. Traders are urged to acknowledge and be prepared for either directional outcome with a current bias to the bull side.


Finally, we’d like to review some very long-term conditions. We continue to maintain that the price action from Feb’16’s 258.9 low is virtually identical to that that followed Dec’08’s 235.5 low and subsequent base/reversal PROCESS. Like the price action from Jun’09’s 433 high until Dec’11’s resumption of Dec’08 – Jun’09’s initial counter-trend rally, the price action from Jun’16’s 432.5 high has been every bit as aimless, volatile, challenging and extensive, rejecting repeatedly the lower-quarter of the previous quarters’ range that had been established.
As a result of late-Jul’s bullish divergence in mo, if the market ISN’T getting ready to take off, all the bear’s gotta do is relapse below 322.0. Until at least such weakness is shown, the risk of a 1Q12-type rally remains.
From an even broader perspective, the quarterly log scale chart below shows this market’s 45-year history. For a generation and with the exception of some very temporary spasms, the general 250-area capped this market. Since obliterated by 2007’s global commodity explosion, it should not come as a surprise if this general 250-area now holds as new support for the next generation. Combined with Jan’16’s 258.9 low being just a few bucks away from the (255) 50% retrace of 1999 – 2012’s secular bull run from 120 to 541, it’s hard to ignore 2016’s 258 – 432 rally as just the INITIAL move in a multi-year, “rounding-bottom” PROCESS where the next major move is UP.
As always, we cannot conclude a broader base/reversal count from just a smaller-degree divergence like last week’s. That’s mixing scales and outside the bounds of technical and trading discipline. However, all major trends start with a single smaller-degree step that is subsequently built upon with further proof of strength (in this case) above levels like 334.2. And if this broader bull move is to be deferred until after another interim swoon to the 295 lower-quarter of the multi-year range and basing process, then the bear’s gotta prove it near-term with a failure below 322.
In sum, a cautious bullish policy and exposure are advised with a failure below at least 326 and preferably 322 required to threaten and negate this call and warrant its cover. A break above 343.2 will reinforce this call and expose further and possibly surprising gains. In effect, the market has identified 322 and 343.2 as the key directional triggers heading forward.


