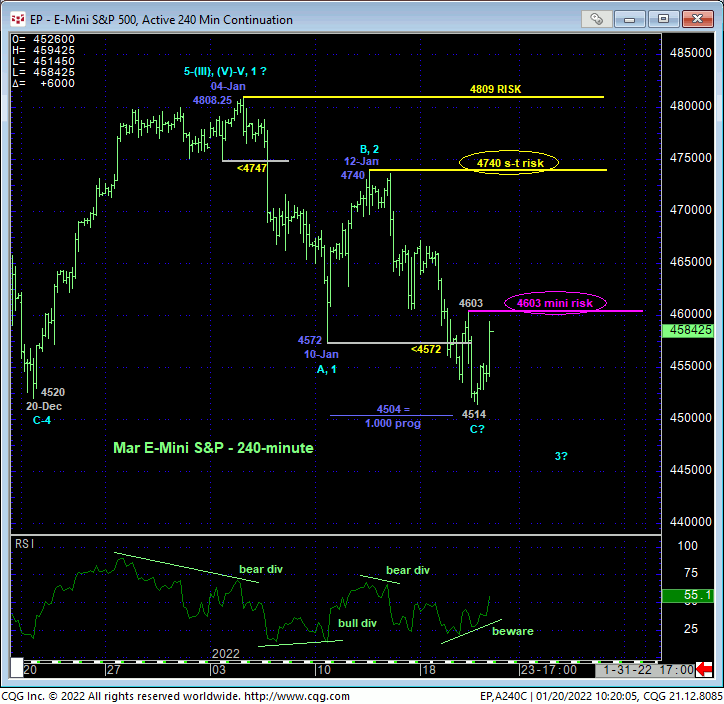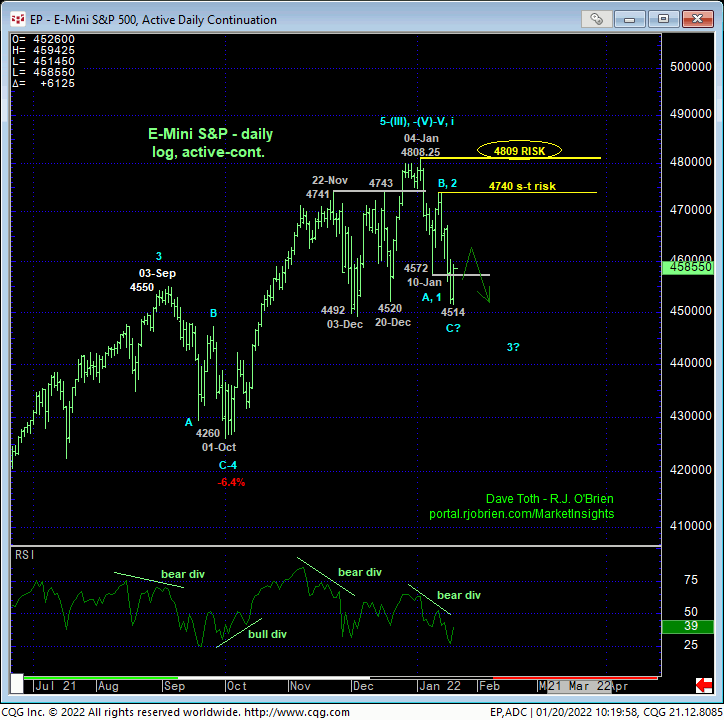
In our constant pursuit of objectively managing risk of directional biases and exposure, we’re always on the lookout for momentum failures needed to stem trends. Following early-Jan’s continuation of the secular bull trend, we were able to identify risk levels the bull needed to sustain gains above to maintain a bullish count. In 06-Jan’s Technical Blog we introduced a peak/correction/reversal threat directly on the heels of 05-Jan’s bearish divergence in very short-term momentum. This mo failure defined 04-Jan’s 4808.25 high as one of developing importance from which non-bullish decisions could be objectively based and managed.
More than two weeks on and following Tue’s break below 10-Jan’s 4572 initial counter-trend low, those early and minor threats to the bull have reached at least intermediate-term levels as the market has lost 6%. Now, “down here”, we’re on the lookout for elements needed to defer or threaten a broader peak/reversal process and give odds to the ultimately bullish prospect that this month’s 6% decline is a 3-wave and thus corrective affair that might re-expose the secular bull trend.
The 240-min chart below shows that, thus far at least, the decline from 04-Jan’s 4808.25 high to yesterday’s 4514 low is only a 3-wave structure as labeled. But while a recovery above 12-Jan’s 4740 corrective high remains required to CONFIRM such a bullish count, this chart also shows the developing potential for a bullish divergence in very short-term momentum. This divergence will be considered CONFIRMED to the point of non-bearish action by short-term traders on a recovery above yesterday’s 4603 corrective high. Per such, this 4603 level is considered a mini risk parameter, the recovery above which will define yesterday’s 4514 low as one of developing importance and a new mini risk parameter from which the risk of non-bearish decisions can be objectively based and managed.
Can we conclude the end of the correction by such piddly strength above 4603? No, no more than we could conclude a massive reversal lower by 05-Jan’s piddly failure below 4747. But such 4603+ strength could be pursued as a start of a recovery that would then require further, sustained, trendy, impulsive gains above 12-Jan’s next larger-degree corrective high at 4740 needed to resurrect odds of the secular bull trend’s resumption. But most importantly, 4603+ strength would identify some semblance of early strength and bull potential from that 4514 low that would then serve as the objective risk parameter to any bullish decisions.


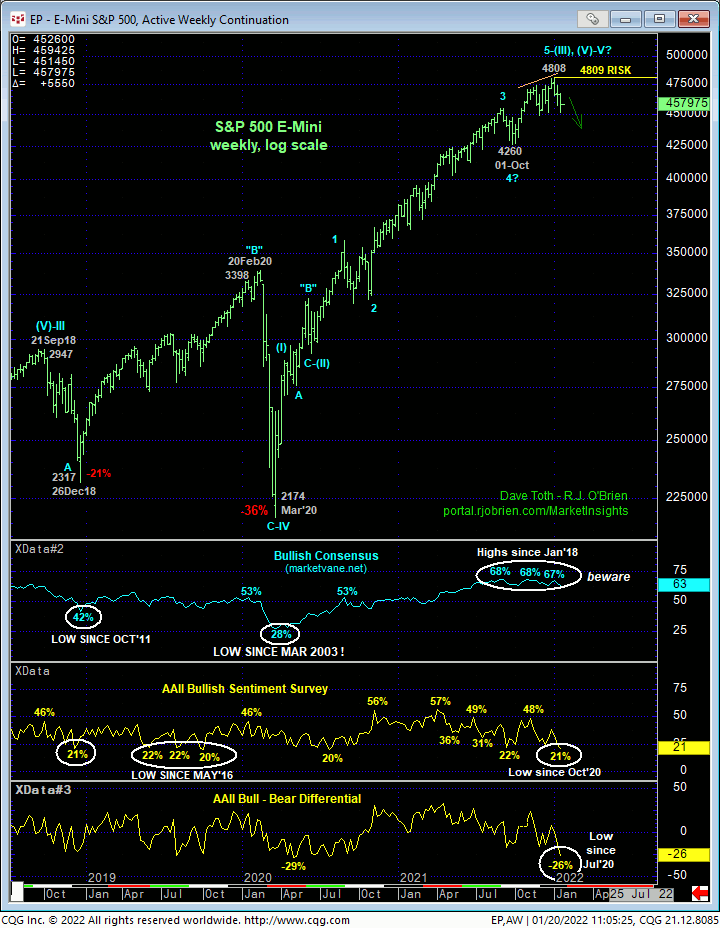
On a broader scale and until the market recovers above at least 4603 and preferably 4740, a broader peak/correction/reversal threat remains intact ahead of what could be protracted losses. Waning upside momentum since early-Nov and historically frothy levels in the Bullish Consensus (marketvane.net) measure of market sentiment/contrary opinion remain intact as threats against the major bull market.
Interestingly however, the American Association of Individual Investors (AAII) Bullish Sentiment Survey and Bull-Bear Differential have both eroded to historical lows that, in the past, have been associated with the ENDS of corrections and starts of the resumptions of the secular bull trend. This factor will become increasingly important in support of a resumed long-term bull trend upon proof of strength in the contract above at least 4603 and especially above 4740. Until the market arrests the clear and present and at least intermediate-term downtrend with strength above levels like these, it would be premature to conclude the end of a correction or reversal lower.
These issues considered, a bearish policy and exposure remain advised with a recovery above at least 4603 and preferably 4740 before a bullish policy can be reconstructed. In lieu of such strength and especially if this market breaks yesterday’s 4514 low, further and possibly steep losses remain expected.


