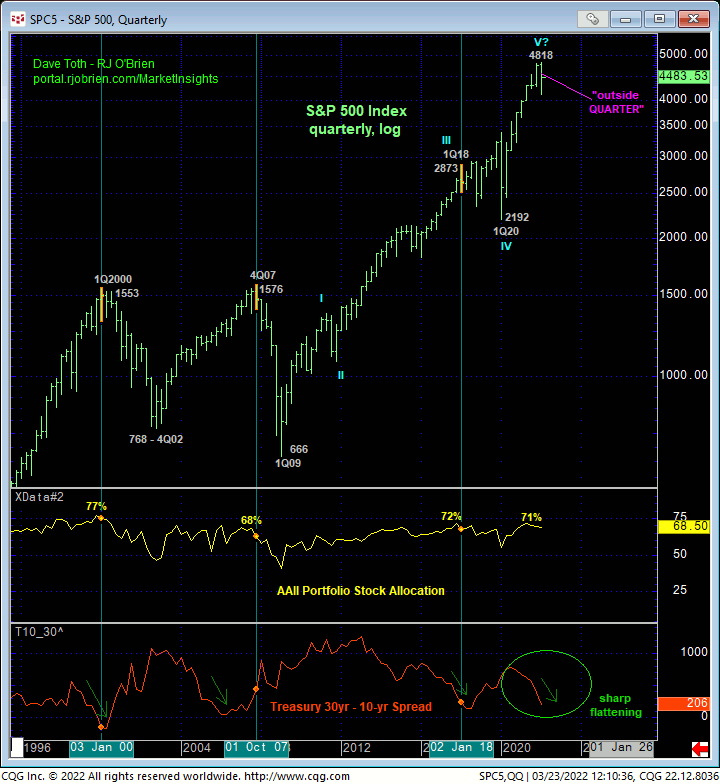
On the heels of 16-Mar’s bullish divergence in short-term momentum discussed in 17-Mar’s Technical Blog, the 240-min chart below shows the market’s continued recovery exposed by that momentum failure. With yesterday’s continued rebound however, the market has identified Mon’s 4415 low as the latest smaller-degree corrective low the market now needs to sustain gains above to maintain the intermediate-term uptrend. Its failure to do so will confirm a countering bearish divergence in momentum, arrest the rally and expose at least an interim correction back down and possibly the resumption of Jan-Mar’s broader decline. Per such and for range-center reasons we’ll discuss below, we’re identifying this 4415 level as our new short-term risk parameter from which shorter-term traders with tighter risk profiles can objectively manage non-bearish decisions like short-covers and cautious bullish punts.
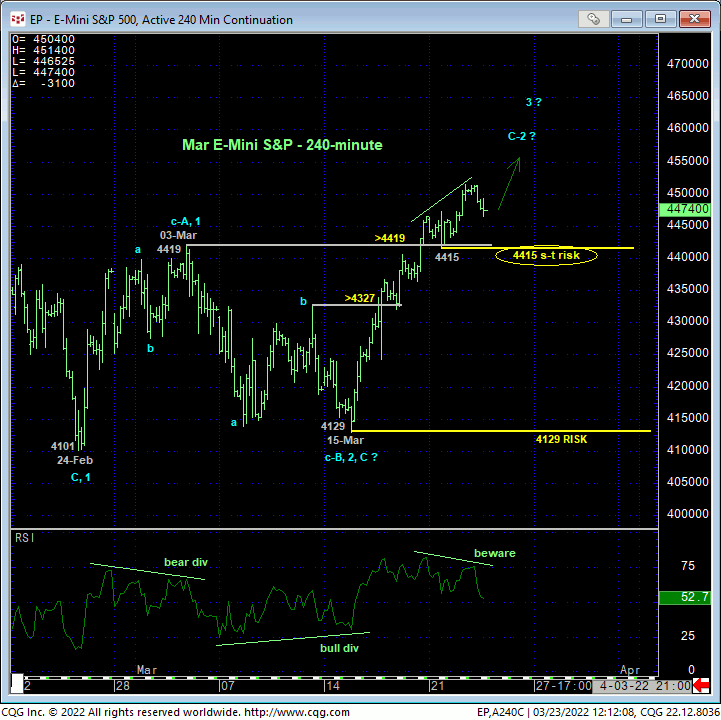
On the next higher scale, the daily log close-only chart below shows the extent of the past couple weeks’ recovery relative to the broader decline from 29Dec21’s 4784 all-time high close to 08-Mar’s 4152 low. From a geeky Elliott perspective, Dec-Mar’s decline is about as pure a 3-wave structure as there is. “Theoretically” and left unaltered by a relapse below 4152, this 3-wave decline may be considered a corrective/consolidative event that warns of an eventual resumption of the secular bull market above 4784. This said however, and again, “theoretically”, this does not mean the correction ENDED at 4152. Indeed, corrective/consolidative environments can be nasty, aimless, choppy, lateral-to-lower beasts that, on this scale, could span months or even quarters.
Understanding this as well as the failings of Elliott “theory” here and there, we try to avoid getting caught up in the aimless, choppy nuances of counting or even trying to count intra-correction waves and rather take a step back and deal with as many facts as we can. Here are the current pertinent facts as we see them:
- the
market has identified 4784 and 4152 as
the obviously key boundaries of 1Q22’s range where
- a recovery above 4784 is required to mitigate a peak/reversal count and reinstate the secular bull and
- a failure below 4152 is required to confirm our major peak/reversal count and re-expose potentially steep losses thereafter
- the intermediate-term trend is up and expected to continue until and unless stemmed by relapse below our short-term risk parameter at 4415
- middles-halves of such ranges are notorious for aimless whipsaw risk, so the risk/reward merits of initiating directional exposure around current levels is poor
- middle-halves of ranges warrant a more conservative approach to risk assumption that emphasizes tighter yet objective risk parameters like 4415.
Under such lateral, rangey environments, we watch for a recovery-stemming bearish divergence in momentum from the upper-recesses of the range for a preferred risk/reward opportunity from the bear side and, conversely, a bullish divergence in momentum from the lower recesses of the range for a favorable risk/reward punt from the bull side.
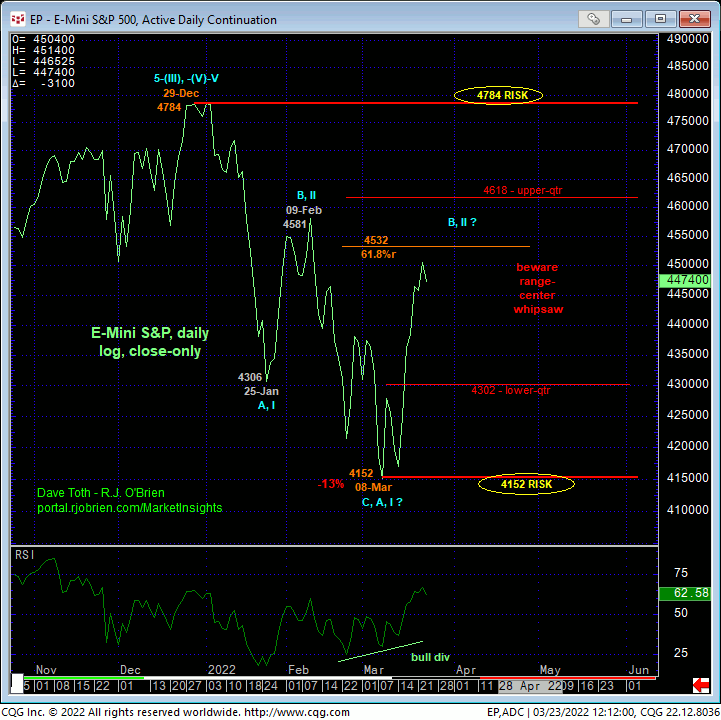
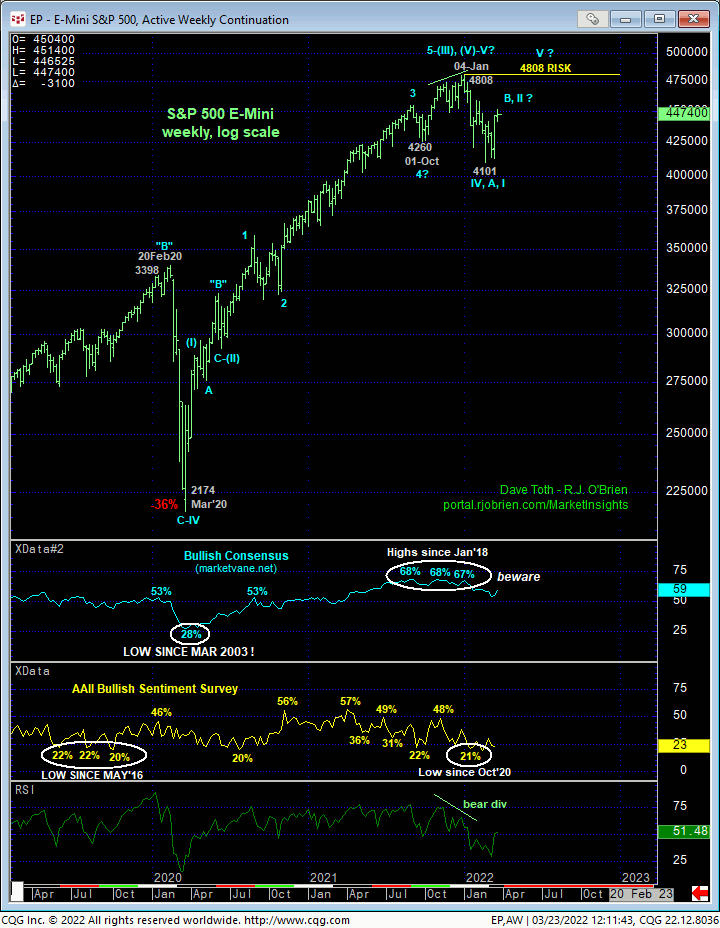
From a longer-term perspective, these peak/reversal-threat facts remain intact:
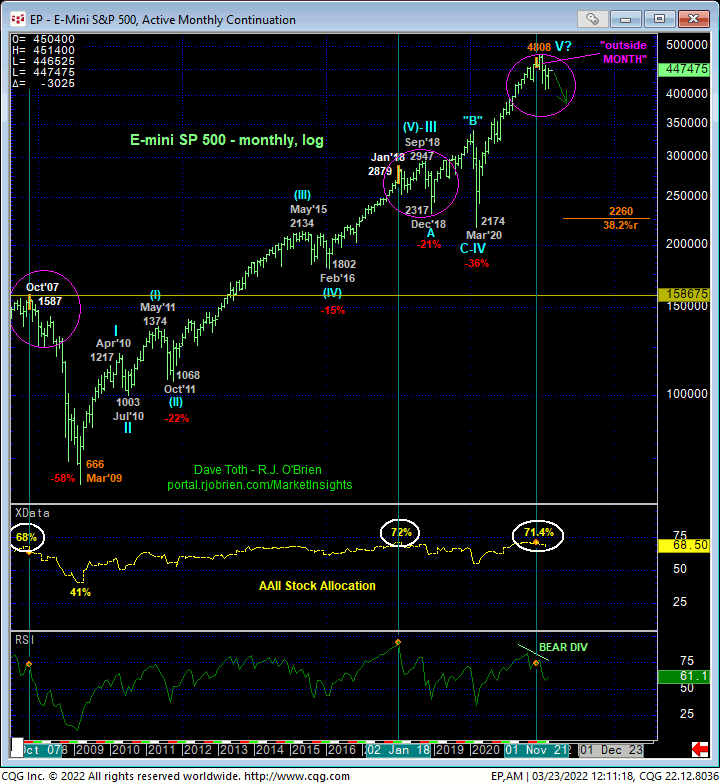
- a bearish divergence in MONTHLY momentum that, in fact, breaks the uptrend from a least Mar’20’s 2174 low
- recently historically frothy bullish sentiment and portfolio equity allocations and
- an “outside month down” the month of Jan’s high (higher high, lower low and lower close than Dec’s range and close).
This confluence of factors are the same as those that warned of and accompanied past major peaks and reversals. ON THIS SCALE, a broader bearish count remains intact and requires commensurately larger-degree strength above Jan’s 4808 high to negate. The not unimpressive recovery over the past couple weeks is NOT enough to negate this major peak/reversal count. But such a count also requires commensurately larger-degree strength above 4808 to negate and reinstate the secular bull. As always, we cannot mix scales. We cannot conclude the end of a major peak/reversal count based on a mere return to the middle of the past few months’ range. Indeed, on this scale, this month’s recovery is arguably a corrective selling opportunity, with a recovery above 4808 required to negate this call and warrant its cover.
Lastly and relative to interest rates that continue to scream higher, the sharp flattening of the 10-yr-to-30-yr Treasury yield curve (i.e. 10-yr rates rising faster than 30-yr rates) and accompanying historically high portfolio equity allocation warned of and accompanied 1Q2018’s major correction and both 4Q2007 and 1Q2000’s major tops. Per these longer-term technical factors, we maintain a bearish policy and count until negated by a recovery above 04-Jan’s 4808 high. From a short-to-intermediate-term perspective, the trend is up and expected to continue until and unless stemmed by a bearish divergence in short-term momentum below 4415.
If we’re wrong the peak/reversal count and if 08-Mar’s 4152 low completed the correction, the market would/should be expected to sustain trendy, impulsive price action higher straight away and break early-Jan’s high. A rally-stemming bearish divergence in momentum from anywhere north of the (4532) 61.8% retrace of Jan-Mar’s decline will lessen the odds of a bullish count in favor of a broader peak/reversal count. Given the market’s position back in the middle of the 1Q22 range, traders are advised to 1) be leery of aimless whipsaw risk, 2) understand that the risk/reward metrics of initiating directional exposure under these circumstances is poor, 3) watch for a bearish divergence in short-term momentum to tilt short-term directional scales back to the bear side and 4) acknowledge and adhere to technical and trading SCALE commensurate with one’s personal risk profile.
