Posted on Jan 05, 2023, 11:17 by Dave Toth
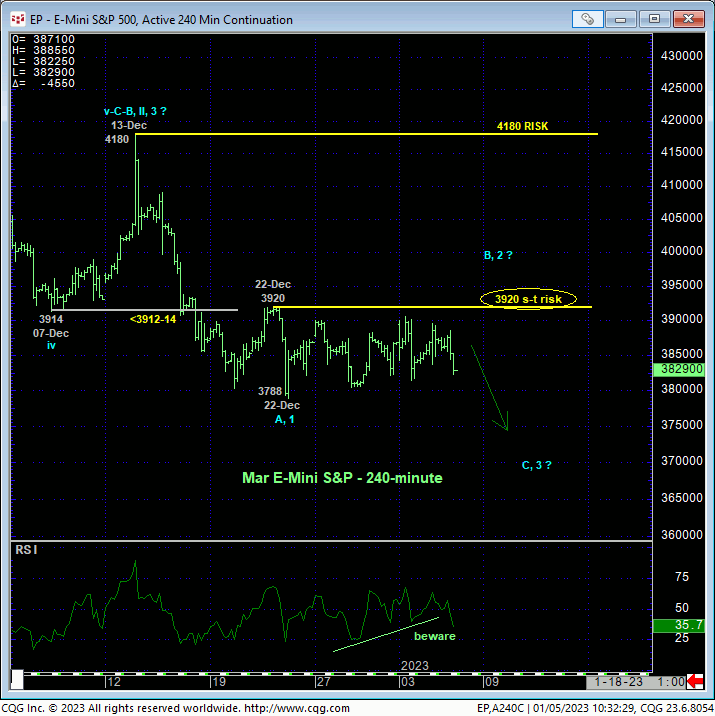
Only a glance at the 240-min chart below is needed to see that the market hasn’t done much since our 16-Dec Technical Blog following 15-Dec’s key bearish divergence in daily momentum that broke Oct-Dec’s recovery and exposed either a steeper correction of that pop or the resumption of 2022’s secular bear trend. What does result from the past couple weeks’ mere lateral chop is the market’s definition of 22-Dec’s 3920 high as the latest smaller-degree corrective high that the market is now minimally required to recover above to break Dec’s slide and expose at least a correction of that 4180-to-3788 decline or possibly a resumption of Oct-Dec’s uptrend. Per such, this 3920 level serves as our new short-term parameter from which shorter-term traders with tighter risk profiles can objectively rebase and manage the risk of non-bullish decisions like long-covers and bearish punts. Until and unless the market can recover above 3920, these past couple weeks’ mere lateral price action is considered corrective/consolidative ahead of a resumption of Dec’s downtrend to new and potentially significant levels below 22-Dec’s 3788 low.
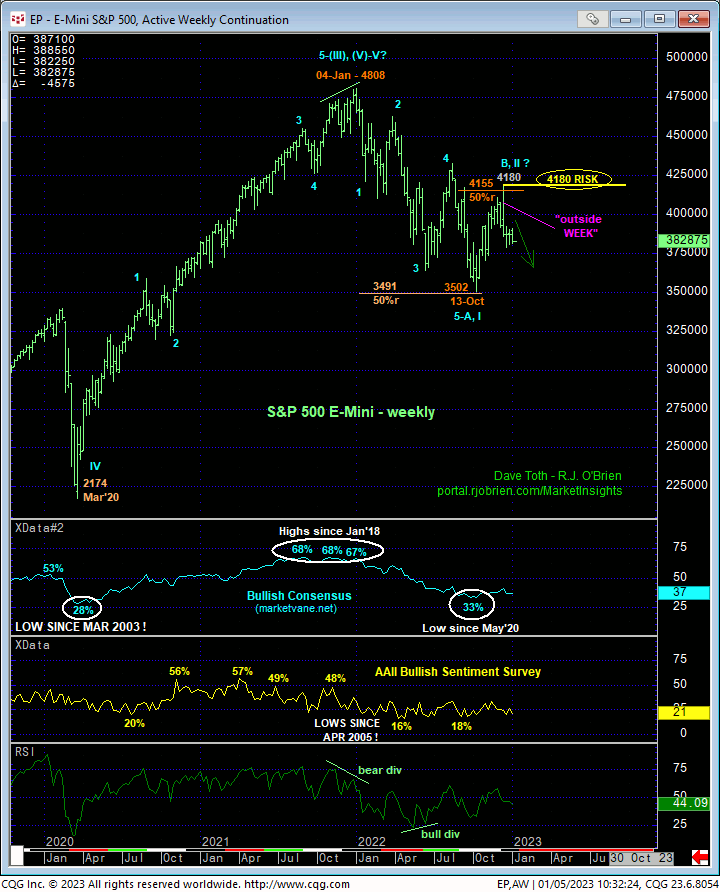
On a broader scale and as discussed in our last update, what we know to be technical facts are:
- 15-Dec’s bearish divergence in daily momentum (above) that broke Oct-Dec’s uptrend and
- defined 13-Dec’s 4180 high as THE level this market now needs to recoup to negate a broader bearish count and resurrect a broader bullish count
- the Fibonacci fact that Oct-Dec’s rally from 3502 to 4180 was virtually identical in length (i.e. 1.000 progression) to Jun-Aug’s preceding bear market correction
- the Fibonacci fact that 13-Dec’s 4180 high is only 25-pts removed from the (4155) 50% retrace of Ja n-Oct’s entire 4808 – 3502 decline on a weekly log scale basis (below), and
- that the market posted an “outside WEEK down” (higher high, lower low and lower close) than the previous week’s range and close THE week of 13-Dec’s 4180 high.
Against the backdrop of the still-arguable long-term downtrend pattern of lower lows and lower highs from Jan’21’s 4808 all-time high, we believe these technical facts warn that 13-Dec’s 4180 high serves as the end or upper boundary of another corrective/consolidative event from 13-Oct’s 3502 low ahead of an eventual resumption of 2022’s major downtrend to new lows below 3502. To even defer, let alone threaten this call, the market needs to recover above 22-Dec’s 3920 smaller-degree corrective high and short-term bear risk parameter. To negate this bearish count, the market needs to recoup 4180. Until and unless such strength is proven, further lateral-to-lower, and possibly much lower prices are anticipated.
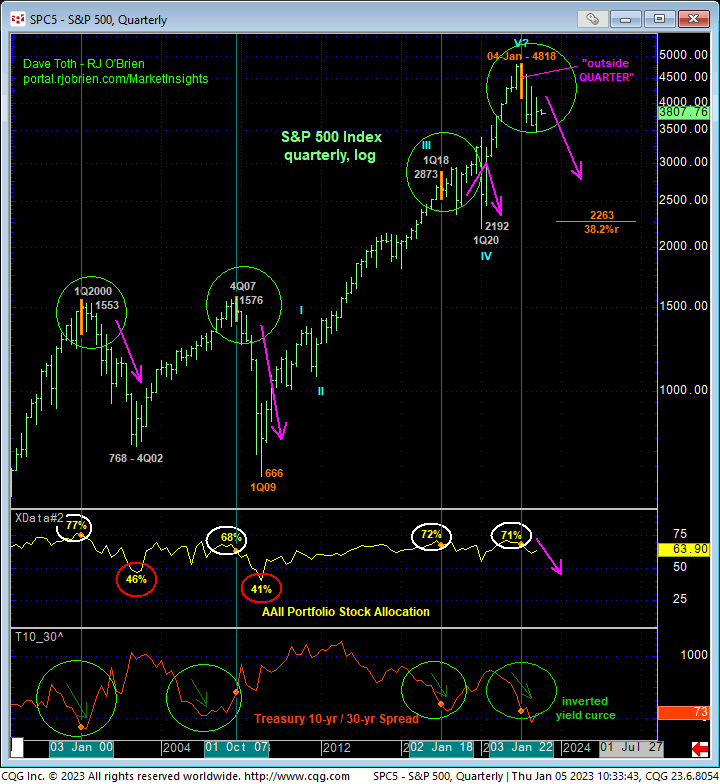
As a refresher to start out the new year, long-term players and investors are reminded of the unique and compelling and long-term technical facts one which our major bearish count remains predicated:
- bearish divergence in weekly and monthly momentum in Jan’22
- historically frothy bullish sentiment/contrary opinion levels in 4Q21 (Bullish Consensus, AAII Portfolio Stock Allocations; Stock-to-Cash ratio)
- “outside week, month AND quarter DOWN” the week, month and quarter of 04Jan22’s 4808 high
- inverted Treasury yield curve
- a complete 5-wave Elliott sequence from Mar’20’s 2192 low to Jan’22’s 4808 high
- an arguably complete and massive 5-wave Elliott sequence from 2009’s 666 low to Jan’22’s 4808 high as labeled in the quarterly log chart below.
We’ve circled in green the three previous occurrences of such technical facts: 1Q2018, 4Q2007 and 1Q2000. In each case the market suffered either a major volatile correction (2018-to-2020) or a major bear market (2007 – 2009 58% drawdown and 2000 – 2002 50% drawdown). The extent of the bear market from Jan’22’s 4808 high is indeterminable and potentially severe, as severe or even more so than the 20007 – 2009 and 2000 – 2002 bear markets. To even defer let alone threaten this broader bear, and for the technical facts cited above, this market needs to recover above at least 13-Dec’s 4180 high, so the RISK on our bearish count and policy has been precisely defined.
These issues considered, a bearish policy and exposure are or remain advised with a recovery above 3920 required for shorter-term traders to move to the sidelines and commensurately larger-degree strength above 4180 required for longer-term institutional players and investors to follow suit and reverse into a cautious bullish policy. Until and unless such strength is proven, further lateral-to-lower, and possibly much lower prices should not surprise.