Navigating T-Note Correction-vs-Reversal Challenge
Posted on Jan 06, 2023, 08:33 by Dave Toth
The 240-min chart below shows the market’s failure this week to sustain late-Dec losses below a minor corrective high at 112.22 from 28-Dec confirms a bullish divergence in short-term momentum. This mo failure defines 30-Dec’s 111.28 low as one of developing importance and possibly the end of a 3-wave decline down from 13-Dec’s key 115.115 high. Left unaltered by a relapse below 111.28 and reinforced by a recovery above 21-Dec’s 114.015 high, this 3-wave sell-off attempt may be considered a corrective/consolidative affair that warns of a resumption of Oct-Dec’s uptrend that preceded it as part of a potentially major BASE/reversal threat. The Fibonacci fact that the (prospective c-Wave) decline from 21-Oct’s 114.015 high was only 3/32s away from the (111.315) 1.000 progression of the initial drop from 13-Dec’s 115.115 high to 21-Dec’s 113.095 low would seem to reinforce this 3-wave correction within a developing bull. Per such, 30-Dec’s 111.28 low serves as our new mini risk parameter from which shorter-term traders can objectively base non-bearish decisions like short-covers and cautious bullish punts.
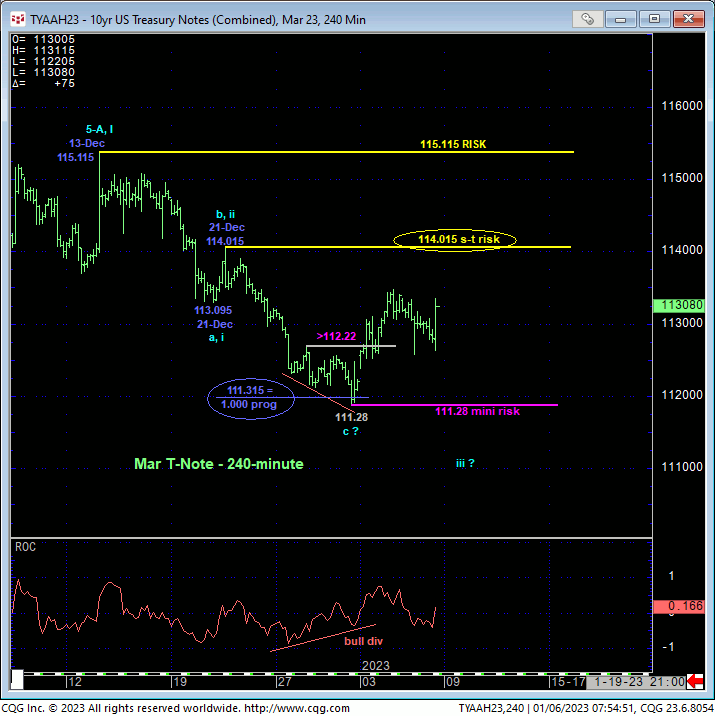
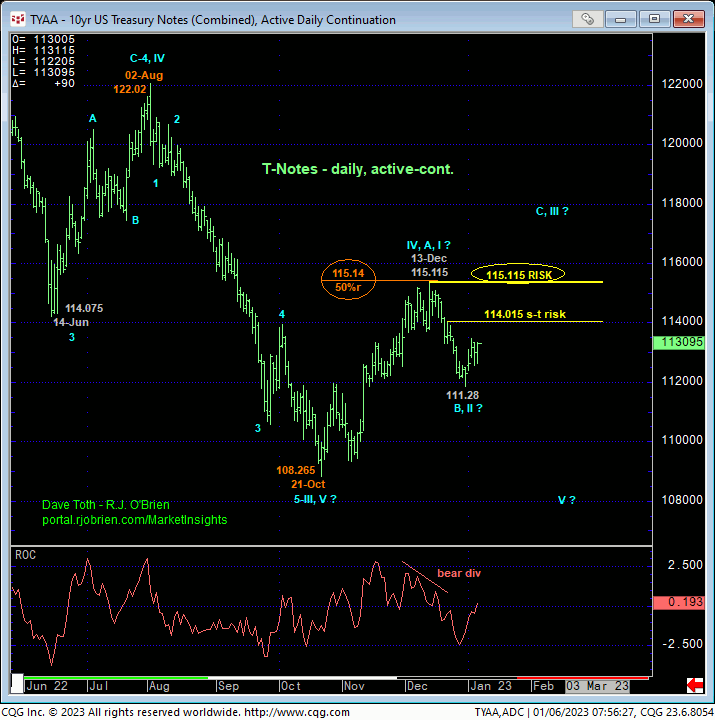
To raise the odds that the second-half of Dec’s sell-off attempt from 115.115 to 111.28 is a 3-wave and thus corrective event, the market still needs to recover above 21-Dec’s 114.015 (prospective b-Wave) high. Until and unless such strength is proven, this week’s pop remains within the bounds of an interim corrective pop ahead of further lateral-to-lower prices from an intermediate-term perspective. And needless to say, commensurately larger-degree strength above 13-Dec’s pivotal 115.115 high remains required to, in fact, reinstate a major base/correction/reversal count and expose potentially sharp gains (and lower rates) thereafter. In this regard, 114.015 and 115.115 remain intact as our short- and longer-term bear risk parameters from which longer-term players can objectively base non-bullish decisions like long-covers and resumed bearish exposure.
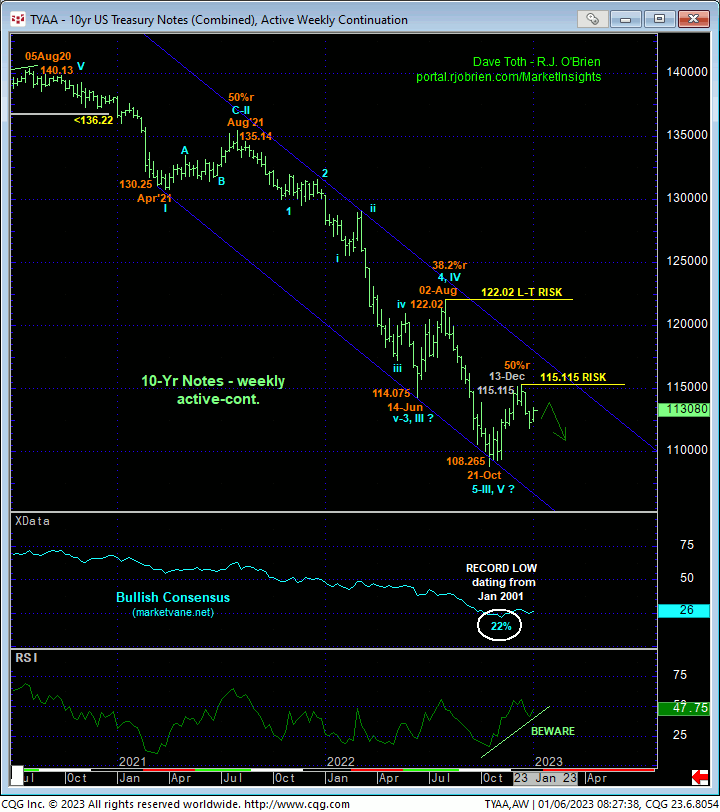
In addition to the backdrop of the secular bear trend from Aug’20’s 140.13 high, the Fibonacci fact that 20-Dec’s bearish divergence in daily momentum stems from the exact 50% retrace of Aug-Oct’s 122.02 – 108.265 decline reinforces 13-Dec’s 115.115 high as a pivotal level the market should be required to recoup to mitigate a broader bearish count and resuscitate a base/reversal count.
Indeed, it’s interesting to note on a massive weekly active-continuation chart below, the fact that every multi-month corrective recovery attempt withing the secular bear market has stalled precisely at either a 38.2% or 50% retrace of the preceding downtrend. This said, what remains compelling about a base/reversal threat that could be major in scope is the unique combination of:
- an arguably complete and massive 5-wave Elliott sequence from Aug’20’s 140.13 high to 21Oct22’s 108.265 low as labeled below
- late-Oct’s record low since Jan 2001’s inception of 22% in the Bullish Consensus (marketvane.net) measure of market sentiment/contrary opinion, and
- the nicely developing POTENTIAL for a bullish divergence in WEEKLY momentum that will be considered CONFIRMED to the point of non-bearish action on a break above 13-Dec’s 115.15 high.
These issues considered, short-term traders have the option of playing this market from either the bull side with a failure below 111.28 required to negate this call and warrant its cover OR from the continued bear side with a recovery above 114.015 required to negate this call and warrant its cover. Longer-term institutional players remain advised to maintain a bearish policy and exposure with a recovery above 114.015 required to pare exposure to more conservative levels and commensurately larger-degree strength above 115.115 required to not only neutralize remaining exposure, but also reverse into a new bullish policy.