Posted on Jun 06, 2023, 08:53 by Dave Toth
Starting from a very long-term perspective shown in the weekly chart of the contract, the debate rages on as to whether the recovery from last Oct’s 108.265 low is merely corrective/consolidative ahead of the eventual resumption of the secular bear from Aug’20’s 140.13 high OR part of a major base/reversal process. As discussed since the extent and impulsiveness of Oct-Dec’s initial counter-trend rally, the combination of a bullish divergence in weekly momentum amidst historically bearish sentiment/contrary opinion levels and an arguably textbook complete and massive 5-wave Elliott sequence down from that 2020 all-time is unique and compelling and intact until negated by a relapse below 108.265.
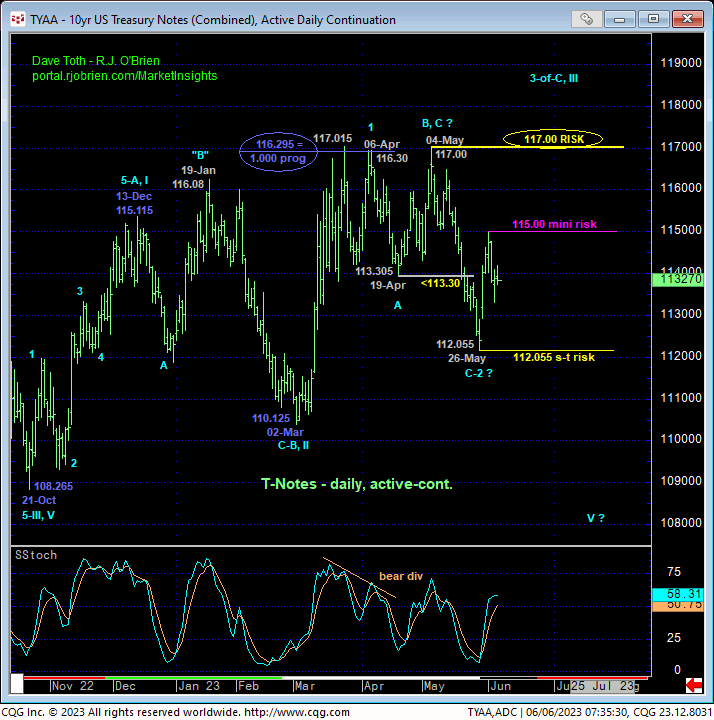
Given the extent of May’s relapse however, an alternate count has developed that contends that the recovery from Oct’s 108.265 low to 04-May’s 117.00 high is a 3-wave and thus corrective event that now warns of a resumption of the secular bear market that preceded it. This alternate count remains intact until/unless negated by a recovery above 117.00. Traders are urged to acknowledge and be flexible to either inevitable outcome, the directional ramifications of which are arguably huge.

In Thur’s Technical Blog we discussed that day’s recovery in the now-prompt Sep contract above 24-May’s 114.185 corrective high that confirmed a bullish divergence in short-term momentum sufficient to break May’s downtrend, defining 26-May’s 112.295 low as one of developing importance and a short-term risk parameter from which non-bearish decisions like short-covers can be objectively based and managed. This said however, we also identified a smaller-degree corrective low at 114.01 the market needed to sustain gains above in order to maintain a more immediate bullish count. It’s failure to do so yesterday confirmed a recovery-stemming bearish divergence in very short-term momentum that defined Thur’s 115.00 high as another threshold of developing importance and level from which shorter-term traders can objectively base non-bullish decisions like long-covers. In effect, the 240-min chart of the Sep contract below shows that the market has identified 15.00 and 112.295 as key levels around which directional biases and exposure can be objectively toggled.

We make the distinction of this market’s roll from Jun to Sep as the prompt contract because, on a daily active-continuation basis below, 26-May’s low is 112.055 in the then-prompt Jun contract. Which 26-May low is THE low and risk parameter from which the risk of non-bearish decisions like short-covers should be based on becomes a little bit of a gray area due to the bane of future market contract rolls.
We’ll discuss a more accurate short-term risk parameter based on 10-yr yields below. But while we’re on a daily chart, the takeaway from the chart below is that, TO THIS POINT, the recovery attempt from last Oct’s 108.265 low to 04-May’s 117.00 high is clearly only a 3-wave affair. To CONFIRM this recovery as a 3-wave correction and re-expose 2020 – 2022’s major bear trend, the market needs to break 02-Mar’s 110.125 low. Near-term weakness below 26-May’s low- 112.295 in the Sep contract and/or 112.055 on an active-continuation basis- will raise the stakes in this major bearish count.
To raise the odds of a major base/reversal bullish count, a recovery above last week’s 115.00 high would tip directional scales higher with subsequent larger-degree strength above 117.00 resurrecting a base/reversal count that, at that point, we believe could expose a monster rally. The bottom line here is that the market has been accommodative in identifying some rather acute flexion points around which to toggle directional biases and exposure. The challenge that remains is that by virtue of the market’s residence deep within the past 7-1/2-mponth range, traders must acknowledge and be flexible to either directional outcome. Additionally, the odds of aimless whipsaw risk remain high, warranting a more conservative approach to directional risk assumption. And herein lies the importance of identifying flexion points, like those specified above, around which to manage the risk of directional bets.


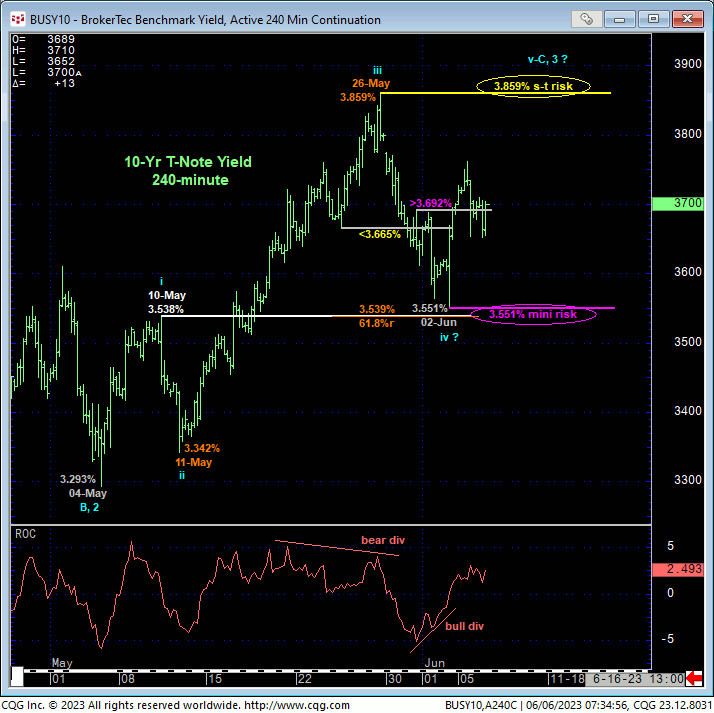
Given the “gray area” resulting from the recent roll from Jun to Sep futures contracts, the 240-min chart of actual 10-yr yields (above) shows 26-May’s 3.859% high as THE most objective level from which to base the risk of bullish bets in the contract (i.e. bets on lower rates). Fri’s bullish divergence in very short-term momentum above 3.692% defines Fri’s 3.551% low as our new mini risk parameter from which to objectively bet on higher rates. This level is analogous to Thur’s 115.00 high in the Sep contract.
What’s important about Fri’s bullish divergence in short-term mo in rates from 3.551% is that this area is also one of key former resistance-turned-support on a daily log close-only basis below. Indeed, since mid-May’s breakout above mid-Apr’s 3.600%-area resistance, this area has become one of new support. Thus far, as a result of Fri’s bullish divergence in momentum, the market has played this new role well, reinforcing this 3.55%-to-3.60%-area as a key one from which to base directional bets on higher rates and lower prices in the contract.
Another key takeaway from the daily log close-only chart of 10-yr yields below is the textbook 3-wave nature of the decline from last Oct’s 4.251% high to 06-Apr’s 3.305% low. Against the backdrop of the new secular move higher in rates from 2020’s 0.50% low, Oct-Apr’s rate drop falls well within the bounds of a mere correction. Left unaltered by a relapse below 3.305%, this count warns of a resumption of the secular move higher in rates to new highs above Oct’s 4.251% high. For such a prospective move higher in rates in the months ahead, NO ONE is prepared.
These issues considered, a neutral-to-cautiously-bearish policy and exposure are advised for both short- and long-term traders with a recovery above 115.00 required to reverse into a neutral-to-cautiously-bullish stance. A recovery above 26-May’s 3.859% yield high will reinforce a bearish count in the contract that could subsequently produce sharp losses thereafter, including a resumption of the secular bear market.


