Posted on Oct 14, 2022, 08:38 by Dave Toth
- The trend is your friend.
- There
are two definitions of a bullish divergence in momentum:
- a recovery above a prior corrective high of a scale sufficient to threaten the trend
- a recovery above an initial counter-trend high of a scale sufficient to threaten the trend.
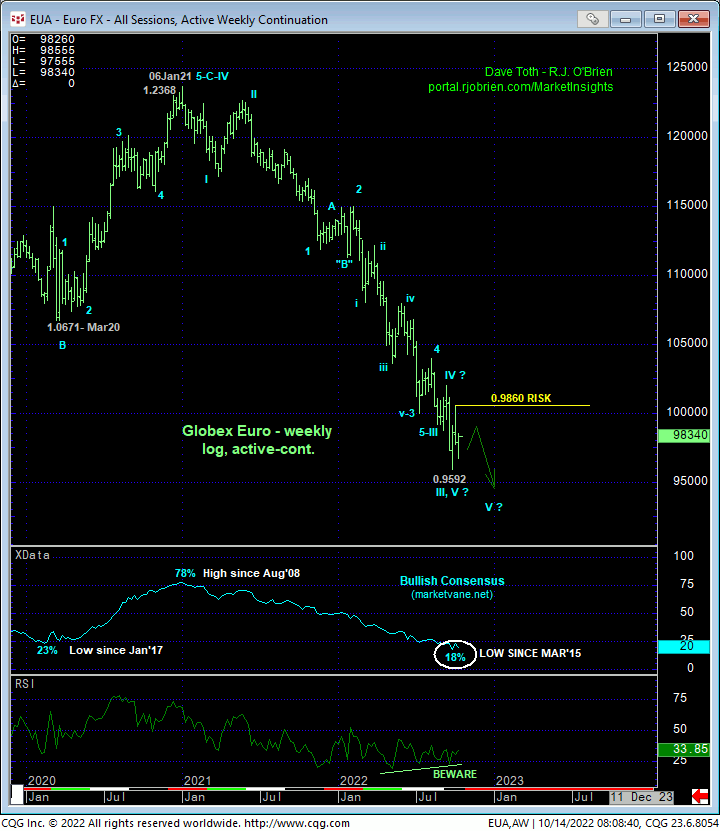
Only a glance at the weekly log chart below is needed to see that the trend in the euro remains markedly down. With all the iterative corrective stair-steps down over the past 11 months, it’s impossible to rely on a wave count that concludes whether the broader decline from Jan’21’s 1.2368 high has completed 3- or 5-waves, so we’re not even gonna try. What we can identify with specificity however is 04-Oct’s 1.0055 high that, IF BROKEN, would render that high an initial (A- or 1st-Wave) counter-trend high and expose at least a larger-degree correction higher or possibly a major reversal. Until and unless such 1.0055+ strength is shown, the secular downtrend remains intact and should not surprise by its continuance or acceleration, with the past few weeks’ merely lateral gibberish no different than any of the other five consolidative hiccups since last Nov.
TO BE SURE, this weekly chart also shows two key elements typical of major BASE/reversal environments: historically bearish (18%-to-20%) levels in the Bullish Consensus (marketvane.net) not seen in over seven years and the developing POTENTIAL for a bullish divergence in momentum. The current fact of the matter however is that neither of these factors is APPLICABLE in rejecting/defining a more reliable low and concluding a bottom in the absence of a CONFIRMED bullish divergence in momentum. Herein lies the importance of 04-Oct’s 0.9860 high, the recovery above which is required to confirm a bullish divergence in momentum of a SCALE SUFFICIENT to even defer, let alone threaten the secular bear trend. This is a technical fact.

Longer-term traders are also reminded of the magnitude of this bear. This secular bear market has thus far spanned 14 YEARS and has produced the lowest rates in over 20 years. The lateral chop from 28-Sep’s 0.9592 low is thus far grossly insufficient to conclude anything more than another iterative corrective hiccup within this massive bearish beast.
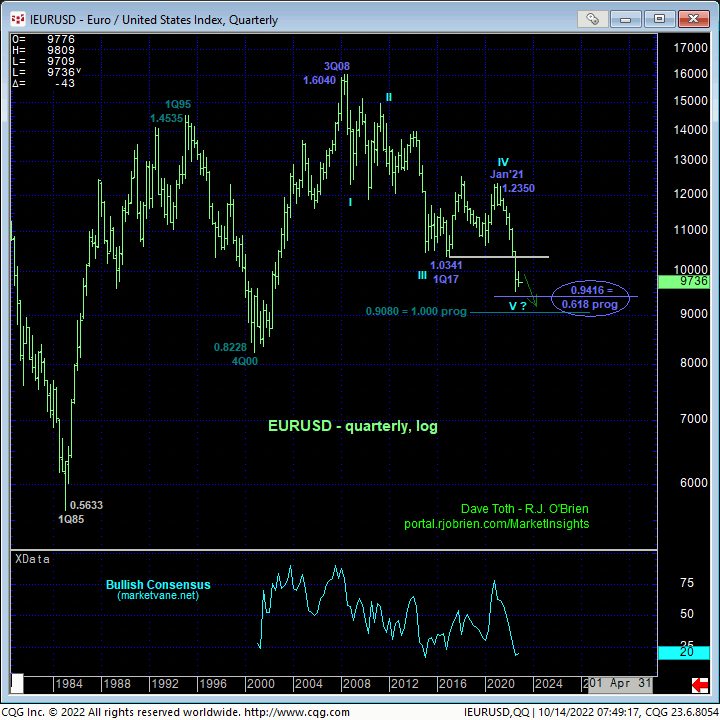
Traders can see in the quarterly log scale chart of the cash EURUSD that we’ve penciled in a prospective 5th-Wave down from Jan’21’s 1.2350 high that includes a couple Fibonacci progression relationships (for what they’re worth) around 0.9416 and 0.9080. But until and unless this market even defers the major downtrend with a bullish divergence in at least weekly momentum, there’s no way to know the decline from 1.2350 isn’t still art of a 3rd-Wave down to oblivion, like 1985’s 0.5633 low area.


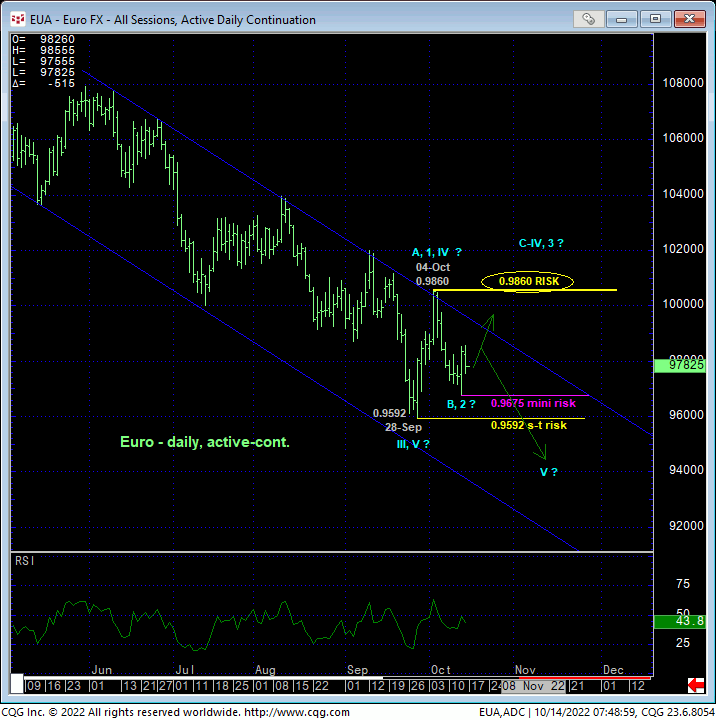
Zeroing in on the past few weeks’ chop and as discussed in yesterday’s Technical Webcast, the 240-min chart below shows yesterday’s recovery above a minor high at 0.9824 that confirms a bullish divergence in very short-term momentum. Especially stemming from the lower-quarter of the past few weeks’ range, this mo failure defines yesterday’s 0.9675 low as one of developing importance and a mini risk parameter from which non-bearish decisions like short-covers and cautious bullish punts can be objectively based and managed ahead of another intra-consolidative-range rebound. To CONCLUDE a broader reversal above 04-Oct’s 0.9860 from this smaller-degree divergence is grossly premature and subjective. Could such 0.9860+ strength happen? Sure. Absolutely. But the risk to such a bet is defined below 0.9675, with further weakness below 28-Sep’s 0.9592 low reaffirming and reinstating a 14-YEAR bear market.
These issues considered, the market has identified 0.9675, 0.9592 and 0.9860 as the key directional flexion points heading forward. Traders are advised to toggle directional biases and exposure around these levels commensurate with their personal risk profiles: neutral-to-cautiously bullish for short-term traders with weakness below 0.9675 and/or 0.9592 negating this call and a continued bearish policy by longer-term institutional players with a recovery above 0.9860 required to threaten this call enough to warrant its cover. Between these flexion points, beware aimless, consolidative whipsaw risk in the week or two ahead.


