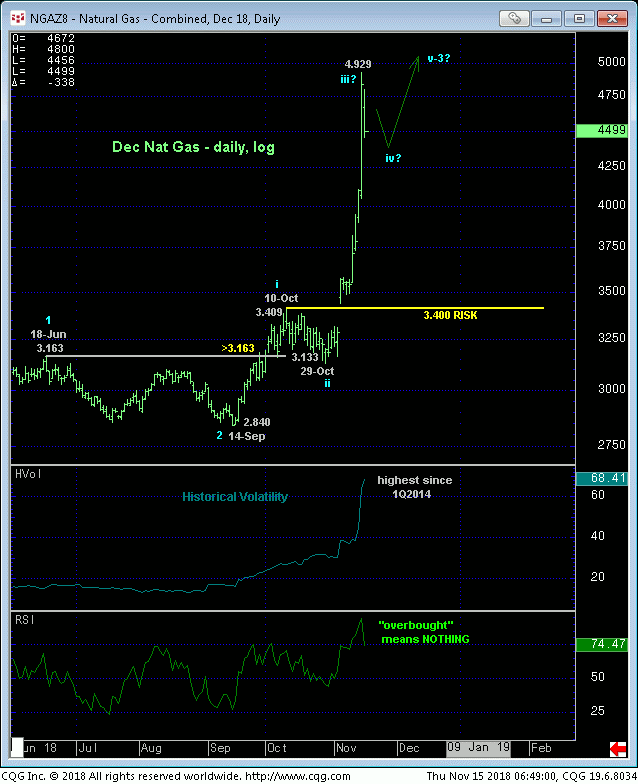
In 02-Oct’s Technical Blog following the prior few days’ break above mid-Jun’s highs (3.064 in the then-prompt Nov contract and 3.163 in the current Dec contract), we discussed not only the fact that at least the intermediate-term trend was up, but also the increasingly bullish prospect that the entire Dec’16-to-Feb’18 labored, 3-wave sell-off attempt was a correction and that the market was poised to resume the major uptrend from 07Mar16’s 1.611 low. Moreover, if this was the case, the bull would be expected to trend higher in a similar impulsive and increasingly obvious manner that we thought could reach at least the 4.00-handle and possibly 5.00. Following a reinforcing and textbook corrective bull-flag event during most of Oct, the past week-and-a-half’s explosive rally has provided exactly price action that obviously reinforces this bullish count.
Now, of course, what’s on everyone’s mind is how far this thing can run.
The daily chart below shows an unsurprising explosion in historical volatility similar to that that accompanied 4Q13-to-1Q14’s emotionally charged continuation of its nearly-two-year rally AND THAT EXPLOSIVE RALLY’S END. This chart also provides the latest example of the total uselessness and irresponsibility in ever referring to a market as being “overbought” (or “oversold”). Those using these terms do not understand that the momentum “tail” never ever wags the underlying market “dog”.
To help navigate the rest of this current bull and its inevitable peak, traders are reminded of two technical factors typical of the ends of trends:
- trends, like trains, have to slow down before they can reverse and
- the huddled masses (contrary opinion/sentiment) are typically fully positioned for the trend to continue.

In the daily chart above, the recent portion of the uptrend is arguably still accelerating. To even set up the POTENTIAL for a momentum failure, somewhere along the line this market is likely to correct lower for a spell and then resume the rally at least one more round of new highs. And this correction/resumption pattern could unfold a number of times.
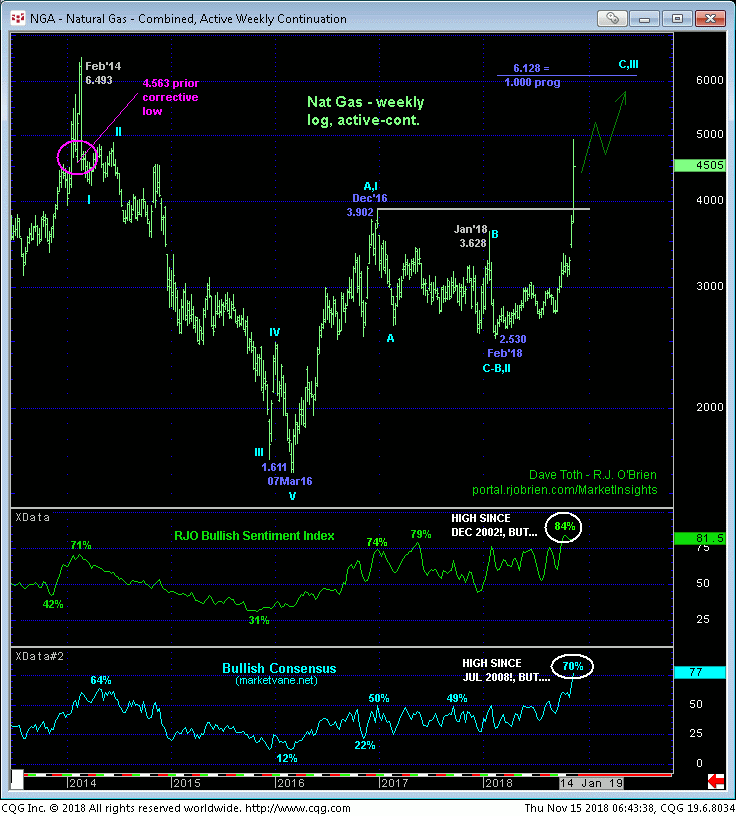
In the last example of such a nat gas bull into Feb’14’s 6.493 high detailed in the weekly log chart below, you’ll notice a few stair-steps higher in that final portion of the bull. The last prior corrective low after the market posted another new high was 10Feb4’s 4.563 circled in pink. It was precisely that low the bull then needed to sustain gains above to maintain the uptrend. When it failed below that point, accompanied by historically frothy sentiment, the market had finally created a totally objective condition from which to make non-bullish decisions.
The current environment shows NO such evidence of waning upside momentum thus far, so we suspect this bull has quite a ways to go, perhaps more in terms of time than price, but more to go, with that remaining time and upward price potentially INDETERMINABLE. In the “for-what-it’s-worth” department we’ve identified the 6.128-area as that that would make the resumed bull from Feb’s 2.530 low the same length (i.e. 1.000 progression) of 2016’s preceding 1.611 – 3.902 rally on a log scale.
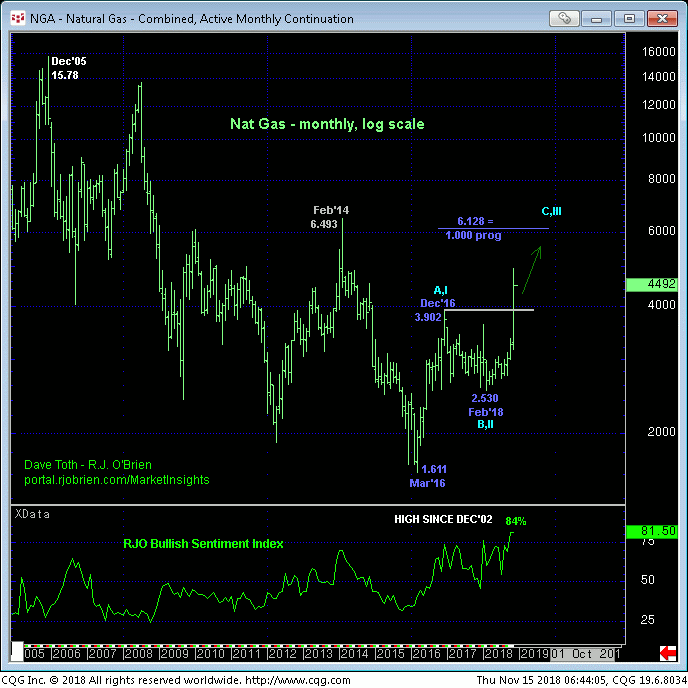
The weekly chart below also shows understandably and historically bullish sentiment typical of major peak/reversal environments. Indeed, the Bullish Consensus (marketvane.net) is the highest in over 10 years and the recent 84% reading in our proprietary RJO Bullish Sentiment Index of the hot Managed Money position reportable to the CFTC is the highest since Dec 2002! HOWEVER, just like referring to a market as “overbought”, sentiment/contrary opinion is not applicable as a technical tool in the absence of a confirmed bearish (in this case) divergence in momentum of a scale sufficient to break the clear and present uptrend. This frothy sentiment condition can sustain itself indefinitely while the bull continues.

Finally, the monthly log chart below shows the magnitude of the current major uptrend relative to its predecessors. After busting out above Dec’16’s 3.902 high, this market has exposed a chasm with virtually no levels of any technical merit shy of Feb’14’s 4.493 high. Under such major up-trending circumstances we would typically cite an area of former resistance-turned-support and a prior corrective low as the only technical levels of merit, but these (3.409 and 3.133) levels are so far away after the past week’s rally that they’re impractical.
This said and while the near-term could be volatile, we strongly suspected at least one round of interim corrective setback ahead of the bull’s resumption. After this price action we will be able to objectively trail a bull risk parameter to the end/bottom of the corrective dip. IN the meantime, a full and aggressive bullish policy and exposure remain advised ahead of further and possibly steep gains to the 6.00-handle.


