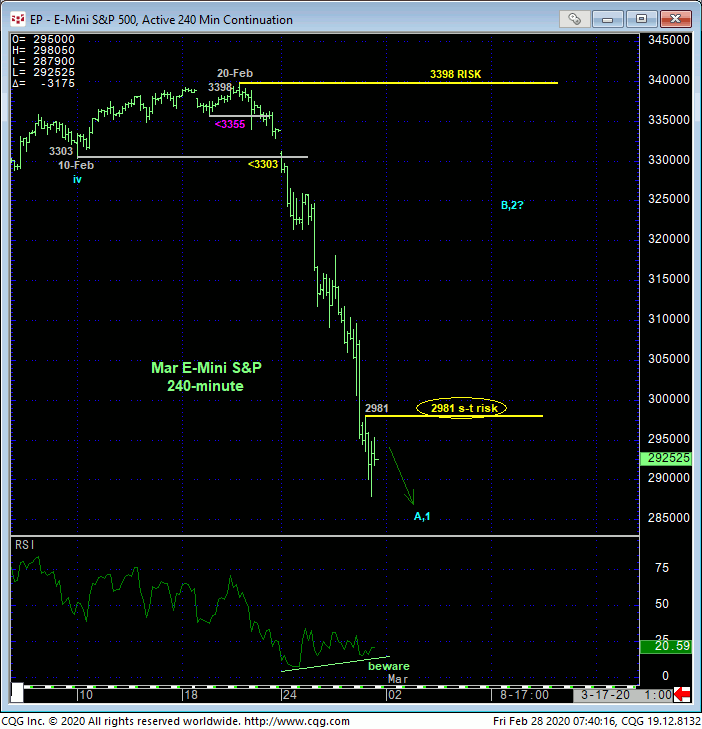
Only a glance at the 240-min chart below is needed to see that the trend remains clearly down and that trying to buck this trend, or catch the proverbial “falling knife” is technically suicidal as there is no objective risk parameter to doing so. This short-term chart show the past few hours’ continued slide leaving today’s overnight high at 2981 in its wake as an admittedly very, very short-term corrective high that this market is minimally required to recover above to confirm a bullish divergence in short-term momentum. We would NOT be able to conclude the END of this month’s mammoth meltdown from such a minute momentum failure. What we WOULD be able to do however is identify whatever low is left in the wake of that momentum failure as one of at least some reliability and importance from which non-bearish decisions like short-covers and cautious bullish punts could then be objectively based and managed. In lieu of such 2981+ strength, the trend remains down on all scales and should not surprise by its continuance or acceleration.


