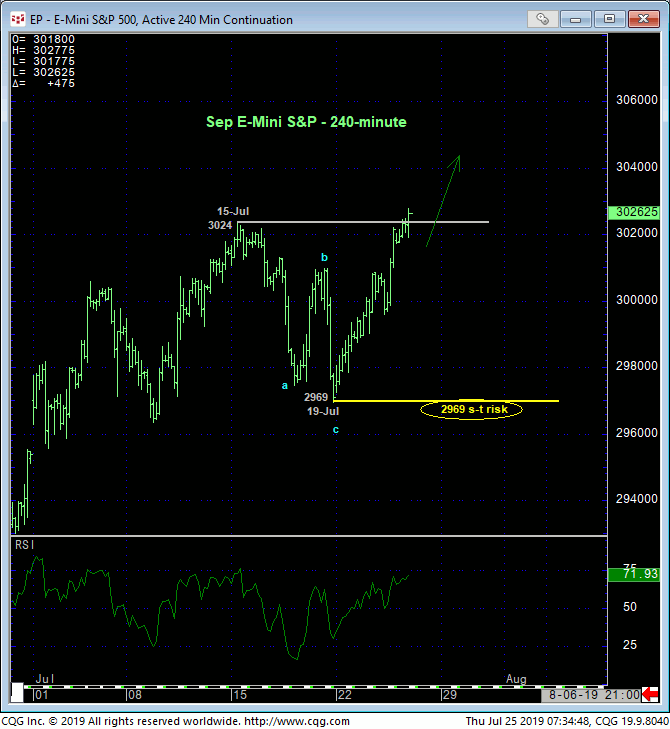
Overnight’s break above 15-Jul’s 3024 high is another new all-time high. The trend is up on all scales and is thus expected to continue and possibly accelerate. The important by-product of this latest spate of strength is the market’s definition of last Fri’s 2969 low as the latest smaller-degree corrective low this market is now minimally required to fail below to confirm a bearish divergence in momentum and expose even an interim correction, let alone any sort of reversal lower. per such this 2969 low becomes our new short-term risk parameter to a still-advised bullish policy and exposure.
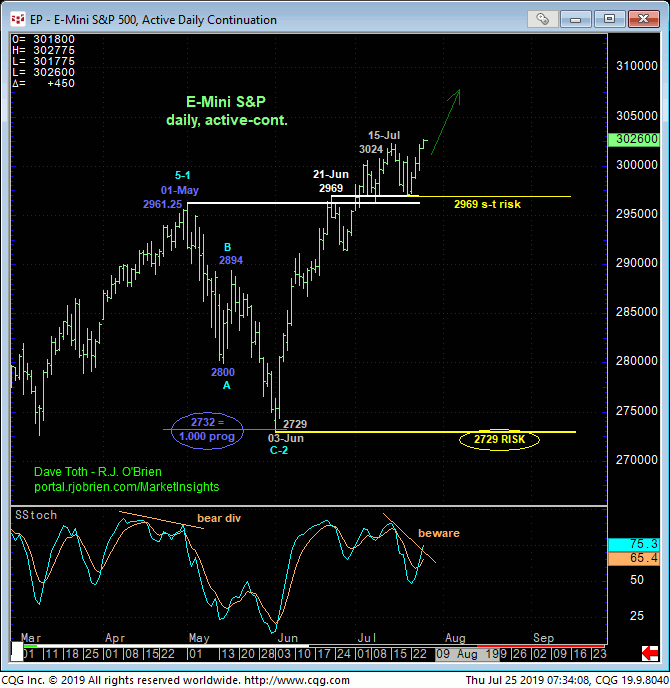
The daily chart below shows last week’s 2969 low respecting former 2960-70-area resistance as new support, consistent with our broader bullish count. The POTENTIAL for a bearish divergence in momentum is easy to see here as well, but proof of weakness below 2969 is required to CONFIRM the signal to the point of non-bullish action like short-covers and cautious bearish punts. In lieu of such weakness and given the magnitude of this secular bull, there is no objective technical reason whatsoever to approach this market in any other ay than from the bull side.
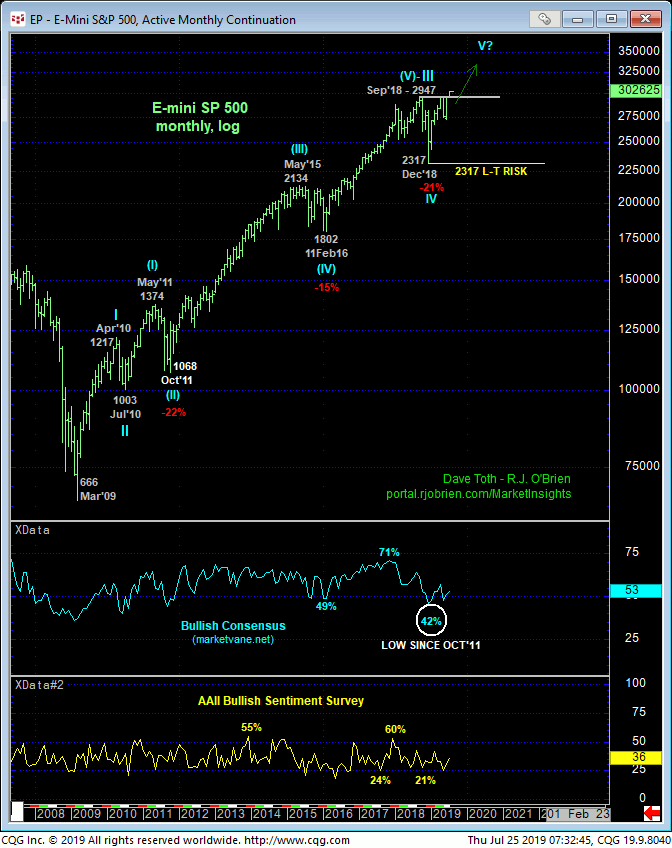
Commensurately larger-degree weakness below 03-Jun’s 2729 larger-degree corrective low and key risk parameter remains required to break the bull and expose a correction or reversal that could be major in scope. A smaller-degree mo failure below “just” 2969 will only allow us to conclude the end of the uptrend from 03-Jun’s 2729 low, nothing more, nothing less.
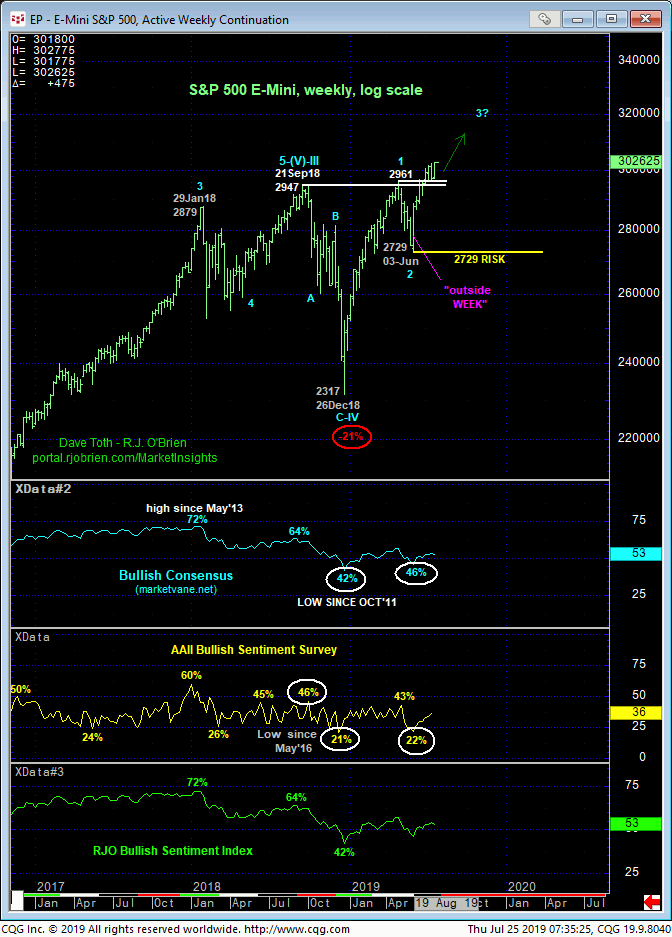
Still contributing mightily to our bullish policy is the fact that market sentiment/contrary opinion remains “cool” to the bull. All three of the sentiment/contrary opinion indicators we monitor closely are still wafting around levels that are more indicative of a DECLINING/corrective environment for this market rather than one that is establishing new all-time highs. We believe this lack of bullishness DESPITE the clear and present uptrend could leave the market vulnerable to further and possibly accelerated gains to force the huddled doubtful mases to chase this bull at what could be much higher prices.
As for upside potential, it is indeterminable as the market has exposed an area totally devoid of any technical levels of merit. In effect, there is NO RESISTANCE. The only levels that exist above the market are those “derived” from past data like Bollinger Bands, imokus, channel lines and even the vaunted Fibonacci progression relationships we cite often in our analysis. But every one of these merely derived levels has NEVER proven to be a reliable way to identify resistance (or support) in the absence of an accompanying bearish (in this case) divergence in momentum needed to, in fact, break the clear and present uptrend. And they never will. The only levels of any technical merit currently exist only below the market in the forms of former resistance-turned-support and prior corrective lows like 2969 and 2729. And until the market proves weakness below these levels, the trend is up and should not surprise by its continuance or acceleration to levels indeterminately higher.
These issues considered, a full and aggressive bullish policy and exposure remain advised with a failure below 2969 required for shorter-term traders to move to the sidelines and for longer-term players to pare exposure to more conservative levels to reduce or circumvent the depths unknown of what we would then believe is just a slightly larger-degree correction of Jun-Jul’s portion of the bull. In lieu of such sub-2969 weakness, further and possibly accelerated gains remain expected.