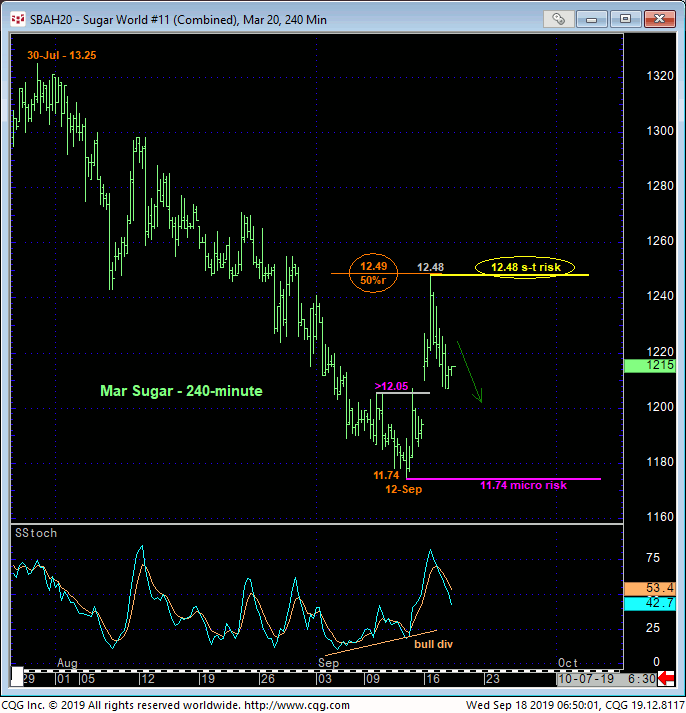
While Mon’s clear recovery above 10-Sep’s 12.05 minor corrective high confirmed a bullish divergence in very short-term momentum that leaves 12-Sep’s 11.74 low in its wake as one of developing importance, the backdrop of the major downtrend and the market’s rejection of the exact (12.49) 50% retrace of Au-Sep’s 13.25 – 11.74-portion of that major downtrend suggest first approaching this 11.74 – 12.48 rebound in the now-prompt Mar contract as another correction. In this regard we’re identifying Mon’s 12.48 high as our new short-term risk parameter from which shorter-term traders can objectively rebase and manage the risk of a still-advised bearish policy.

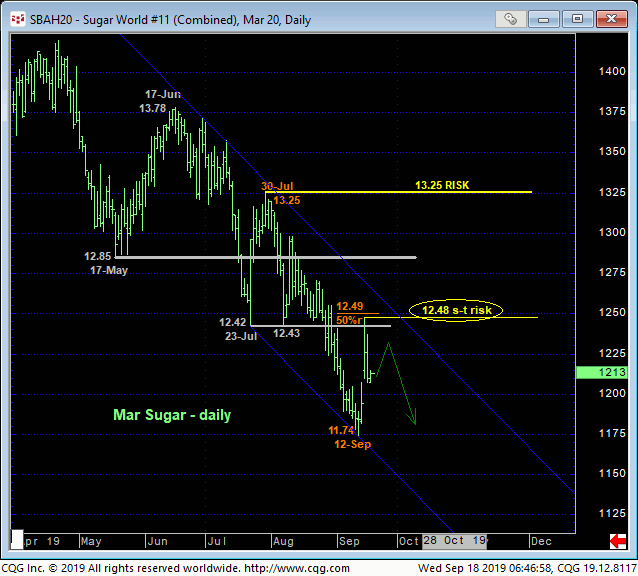
The daily chart below shows that it’s not only the market’s respect for the (12.49) 50% retrace of the decline from 30-Jul’s 13.25 high to 12-Sep’s 11.74 low that warns to first approach the recent pop as a correction, but also it’s acknowledgement of a month’s worth of key former support from the 12.42-area that, since broken in late-Aug, is considered a new key resistance candidate. IF the market has any broader base/reversal plans in mind, it’s gotta prove strength above at least 12.48. And even then, such 12.48+ strength would be of an insufficient scale to conclude a major bottom as commensurately larger-degree strength above 30-Jul’s 13.25 next larger-degree corrective high is required to break the downtrend from Oct’18’s high, let alone the secular bear trend.


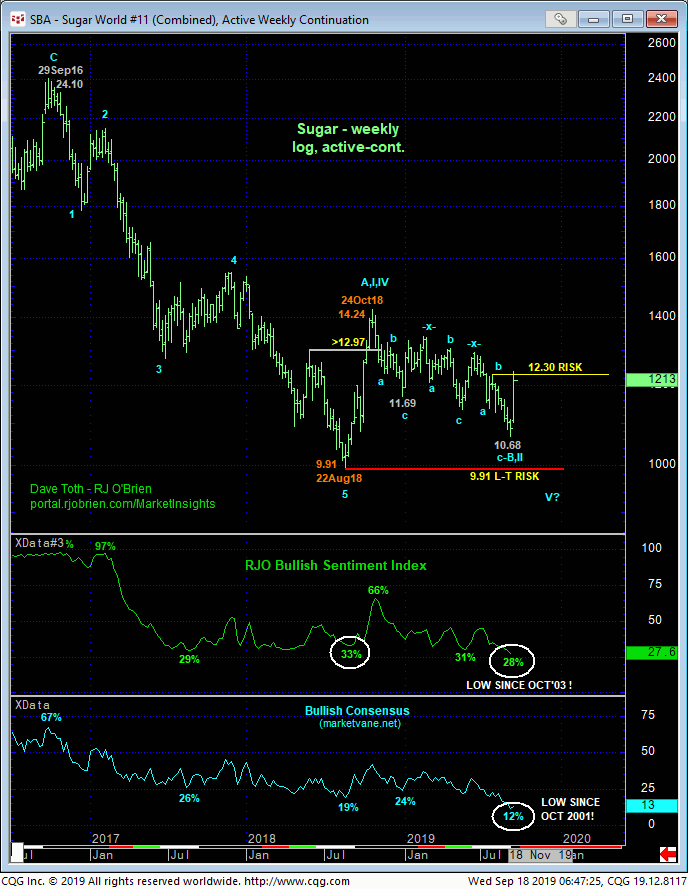
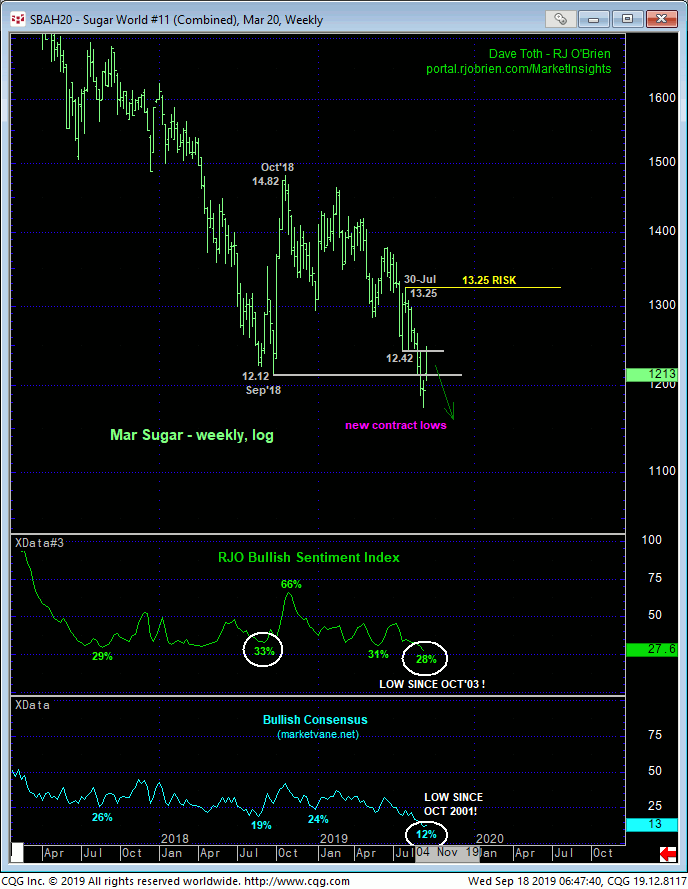
On an active-continuation basis shown in the weekly log chart above, this week’s recovery above 30-Jul’s 12.30 corrective high might be seen as a display of strength that totally reinforces an ultimately bullish long-term count that contends the past 11 months’ very labored decline from Oct’18’s 14.24 high is only a (B- or 2nd-Wave) correction within a major, multi-quarter BASE/reversal process from Aug’18’s 9.91 low. But as this 12.30+ recovery is due solely to the roll from the Oct19 to Mar20 contract, it and any bullish prospects must be approached as questionable. Indeed, looking at a weekly log chart of just the Mar20 contract below where the market established new contract lows in early Sep, it’s clear that this market has yet to provide any price action that can be considered a threat the secular bear trend.
As discussed above, resumed strength above Mon’s 12.48 high- which would then become an initial counter-trend high and confirm a bullish divergence in daily momentum- is minimally required to threaten a bearish count enough to warrant non-bearish action by shorter-term traders with tighter risk profiles. But commensurately larger-degree strength above 30-Jul’s 13.25 next larger-degree corrective high and key long-term risk parameter is required to break the major bear trend and warrant a new bullish policy.
These weekly charts also show understandably historically bearish levels in market sentiment/contrary opinion typical of major base/reversal environments. We’ve no doubt at all that this sentiment condition will eventually play a significant role in a base/reversal process that will be major in scope. But traders are reminded that sentiment/contrary opinion is not an applicable technical tool in the absence of an accompanying confirmed bullish divergence in momentum of a scale sufficient to break or even threaten the major downtrend. Herein lies the importance of the 13.25 and even 12.48 corrective highs and risk parameters identified above. Until and unless the market recoups these levels, we believe the magnitude and dominance of the secular bear trend maintain better odds of a continuation of the bear.
These issues considered, a bearish policy remains advised in the now-prompt Mar20 contract with strength above 12.48 minimally required to threaten this call and warrant a move to the sidelines by shorter-term traders and pared bearish exposure by longer-term players. In lieu of at least such 12.48+ strength, further lateral-to-lower prices are expected in the period ahead, including a run to new lows below 11.74.


