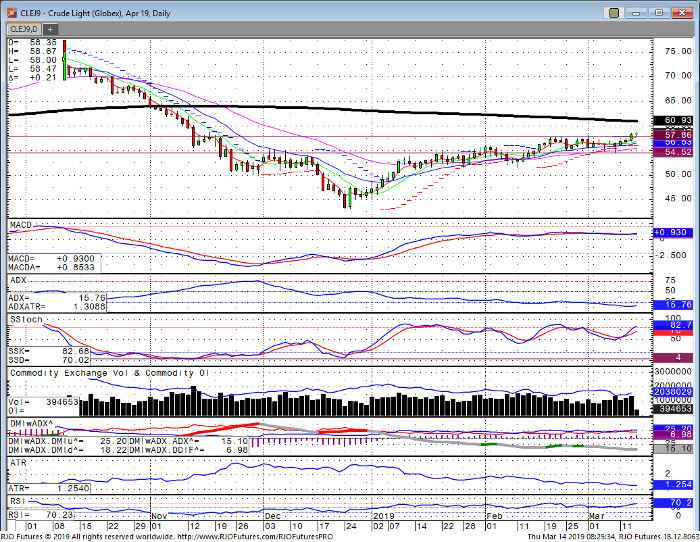
Crude oil futures continue to surprise to the upside as three major factors remain the bullish catalyst. First, from the supply side, we are seeing continued drops in week inventory data as well as in rig counts. This could lead to a rebalancing in the total U.S. supply and bring it back to more normalized levels. Secondly, once the U.S. and China come to an agreement on trade negotiations, this should ignite the Chinese economy and therefore boost demand. Finally, from a technical perspective, there is an upside breakout on the charts which could clear the way to the 200-day moving average. I have outlined some key levels of support and resistance below as well as a chart.
Two Key Levels of resistance are $60.00 and $60.93
*$60.00 Key psychological level
*$60.93 is the 200 DMA
Two Key Levels of support are $57.86 and $54.52
*$54.52 was the washout low from March 8th
*$57.86 was old resistance and is now new support
Crude Oil Apr ’19 Daily Chart

If you would like to learn more about energy futures, please check out our free Fundamental of Energy Futures Guide.


