Posted on Aug 18, 2023, 08:43 by Dave Toth
We always talk about not being able to conclude a larger-degree reversal from proof of just smaller-degree weakness but that every larger-degree failure starts with a smaller-degree failure. This brings the crucial factor of technical and trading SCALE into the trading/investing equation. In 02-Aug’s Technical Blog we discussed that day’s admittedly short-term momentum failure below 27-Aug’s 4553 minor corrective low being of a scale sufficient for shorter-term traders to neutralize bullish exposure. That mo failure was NOT of a scale sufficient for longer-term institutional players and investors to pare or neutralize exposure. Commensurately larger-degree weakness below 10-Jul’s 4411 larger-degree corrective low was required to confirm a larger-degree momentum failure and warrant defensive measures by longer-term players.
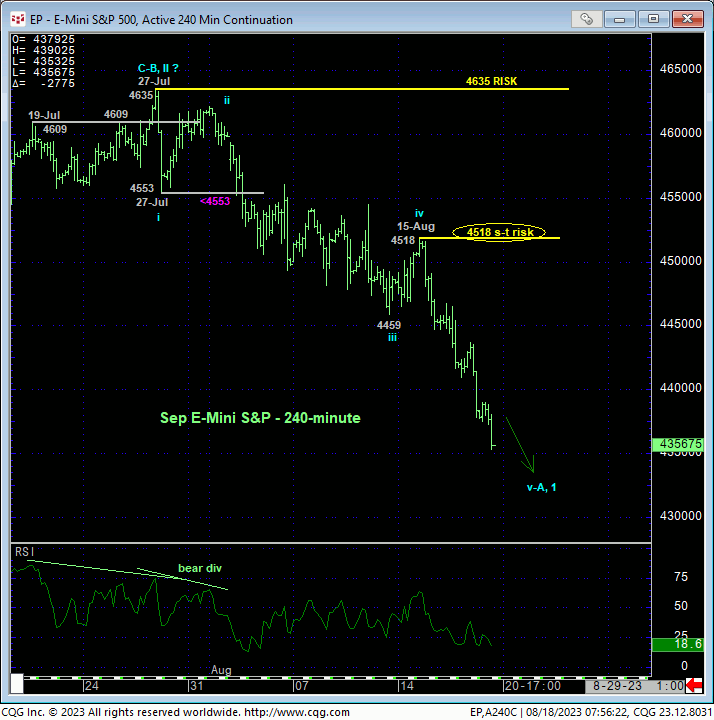
As we’ll discuss below, this larger-degree failure has been confirmed, exposing a larger-degree correction or reversal lower of indeterminable and potentially significant scope. But before stepping back for a longer-term view, the 240-min chart below shows this week’s continued and accelerated decline that leaves Tue’s 4518 high in its wake as the latest smaller-degree corrective high this market is now minimally required to recoup to arrest the slide and possibly expose it as just a slightly larger-degree correction within a much broader bullish scenario. In this regard, this 4518 level serves as our new short-term risk parameter from which non-bullish decisions like long-covers and bearish punts can be objectively rebased and manage by shorter-term traders with tighter risk profiles. The resulting importance of 27-Jul’s 4635 high and resistance to longer-term participants will be addressed below.

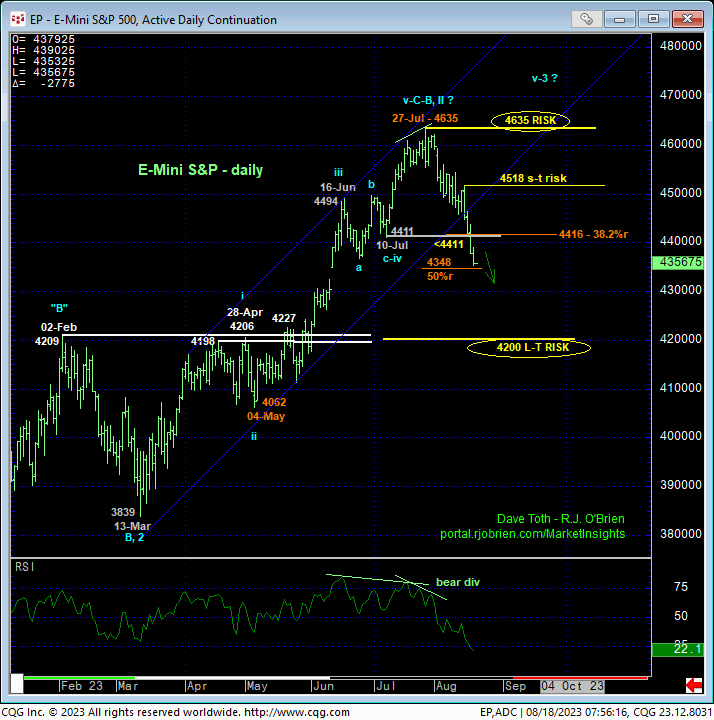
The daily chart below shows yesterday’s clear failure below 10-Jul’s 4411 larger-degree corrective low that confirms a bearish divergence in WEEKLY momentum. This mo failure, in fact, breaks the uptrend from AT LEAST 04-May’s 4062 low, exposing at least a larger-degree correction and possibly, for long-term reasons we’ll discuss below, a more protracted reversal lower of indeterminable and potentially significant scope.
The past three weeks’ sell-off has cruised through the Fibonacci minimum 38.2% retrace of May-Jul’s 4062 – 4635 rally, an area that typically holds a 4th-wave correction. As the market this morning is pressuring the 50% retrace of May-Jul’s rally at 4348, it’s a time where we have to think about whether we should be looking at this decline as a “retracement” within a broader move higher or a “progression” within a new move lower. And as recently discussed, there are NO levels of any technical merit between 10-Jul’s 4411 corrective low and longer-term risk parameter the market just broke and a massively importance area of former resistance-turned-support around the 4200-area.
Long-term bulls who have not taken recommended defensive measures on yesterday’s larger-degree momentum failure below 4411 now only have the 4200-area as an OBJECTIVE exit strategy. What the market has in store for us between 4411 and 4200 is anyone’s guess, with only a sell-off-stemming bullish divergence in momentum capable of arresting the slide and rejecting/defining a more reliable and specific low and support from which non-bearish decisions like short-covers and resumed or continued bullish exposure can only then objectively based and managed. And such a bullish divergence requires a recovery ABOVE a prior corrective high like 4518 at this juncture.


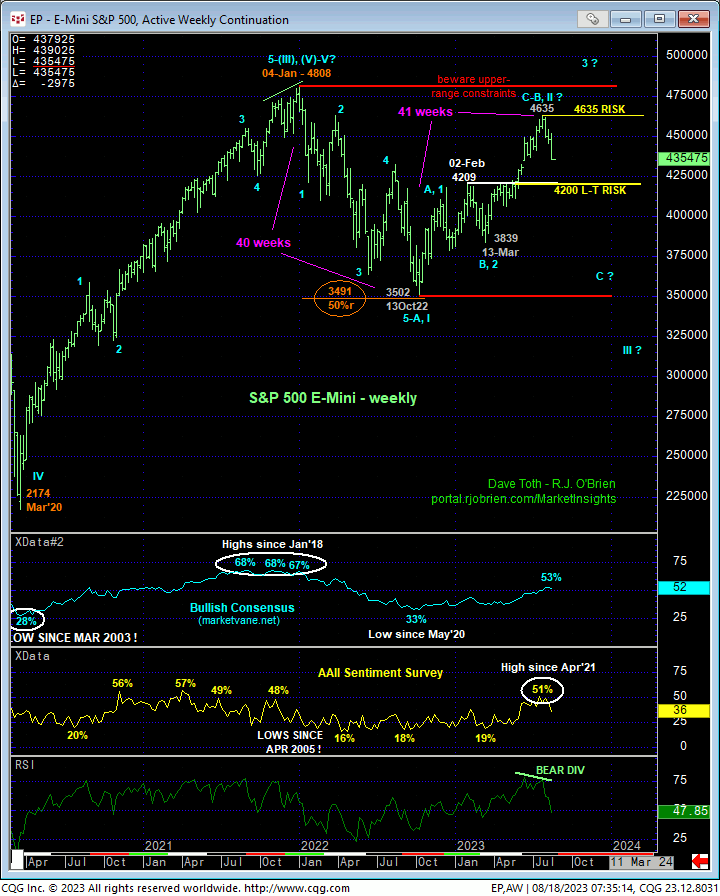
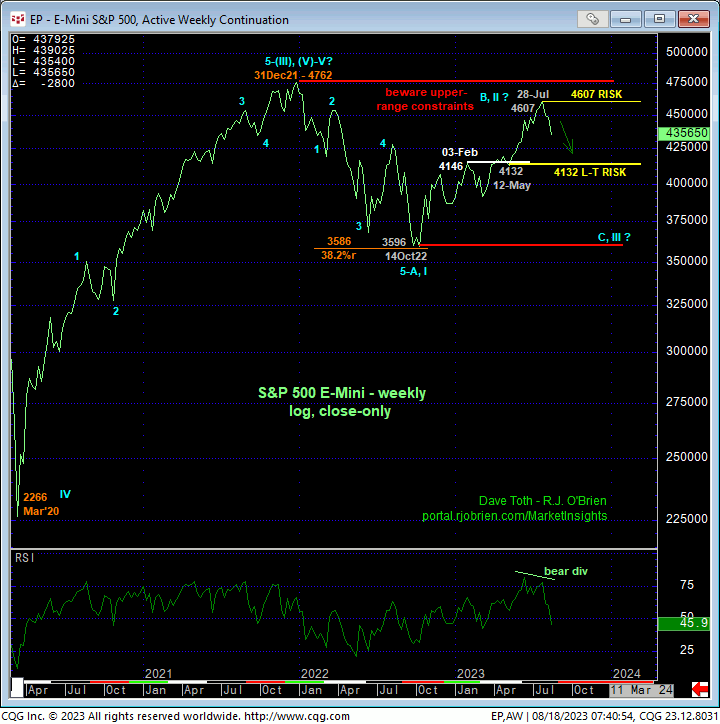
What’s critical about yesterday’s failure below 4411 is that it not only confirms a bearish divergence in WEEKLY momentum shown in the bar chart above and close-only chart below, but also that this major mo failure stems from the extreme upper recesses of the range that dates from Jan’22’s all-time high. Combined with the understandable return to a 51% reading in the American Association of Individual Investors (AAII) Survey, its highest reading since Apr’21, the extent of the market’s vulnerability lower is an unknown and should not be underestimated.
It may also prove notable that the entire recovery from last Oct’s 3502 low spanned an almost identical length of time (41 weeks) to Jan-Oct’22’s downtrend (40 weeks). By itself, this 1.000 time retracement is relatively useless. But combined with the bearish divergence in weekly momentum and the return for benign-to-frothy bullish sentiment levels, it contributes to a peak/reversal threat that warns of a continuation of at least the major correction from Jan’22’s 4808 high that could easily expose a retest of last Oct’s 3502 low, which would be expected to be “C-wave violent”, or a resumption of a new secular bear market that, well, is best saved for our analysis if/when the market breaks 4200.

Lastly, many have heard that one of the root causes of the past couple weeks’ decline in equities is the continued rise in interest rates and the Fed’s likelihood of further rates hikes. The weekly log close-only chart of 10-yr T-Note yields below shows the market on the verge of breaking 21oct22’s 4.21% high weekly yields. On a daily basis, yesterday’s 4.274% close broke 24Oct22’s 4.251% high, reaffirming our long-term count for higher rates and lower price in the T-Note futures contract. In fact, the trend in trend in rates is up on al scales and should not surprise by its continuance that will very likely result in further equity weakness.
MIGHT this latest phase of the rate rise be the completing 5th-Wave of a massive Elliott sequence up from Jul’20’s 0.527% low? Yeah, sure. BUT we will ONLY be able to even remotely speculate on such, and from a short-term perspective, following a confirmed momentum failure below a minor corrective low at 4.01% from 09-Aug (not shown in this weekly chart). Until and unless 10-yr rates see a failure below AT LEAST 4.01%, the trend in rates is higher and is expected to continue.


