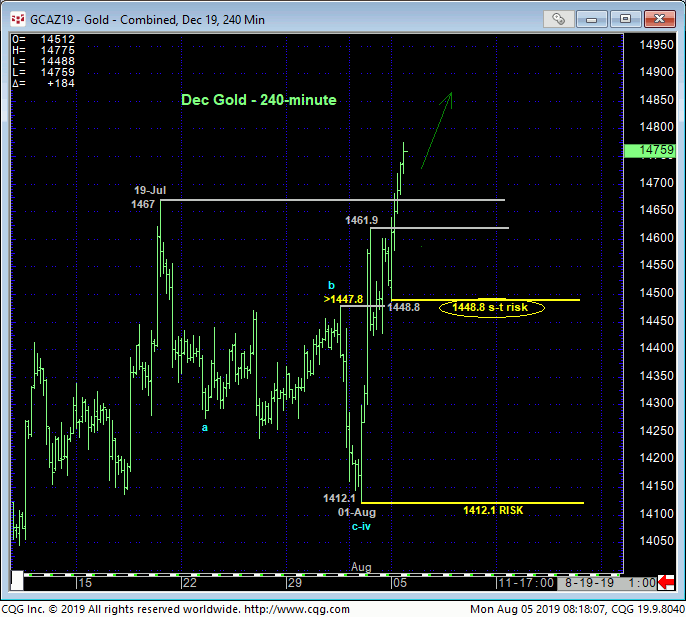
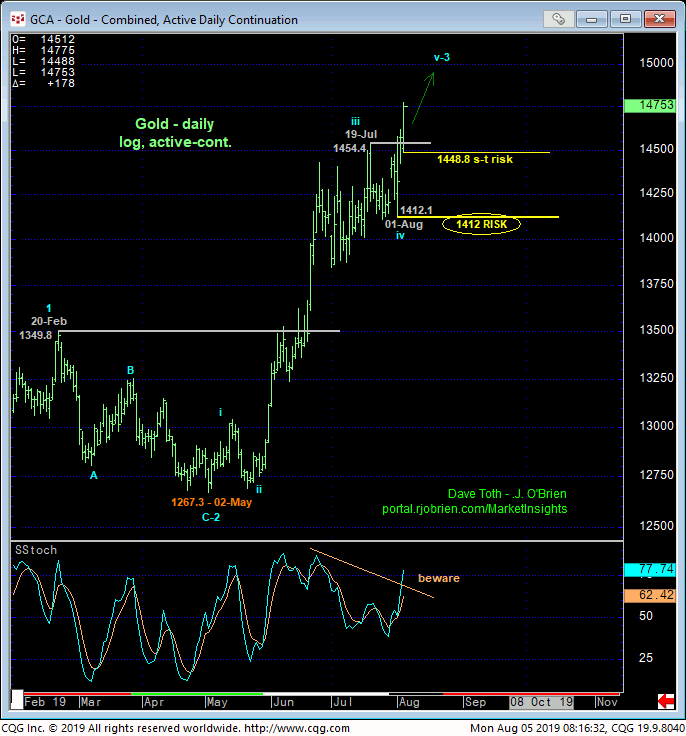
Today’s break above Fri and 19-Jul’s respective highs in the Dec contract at 1461.9 and 1467 reaffirms the major bull trend and leaves new smaller- and larger-degree corrective lows in its wake at 1448.8 and 1412.1, respectively, that now serve as our new short- and longer-term risk parameters from which a still-advised bullish policy and exposure can be objectively rebased and managed. This now-former resistance between 1467 and 1461 is considered a new support candidate ahead of further and possibly accelerated gains straight away.
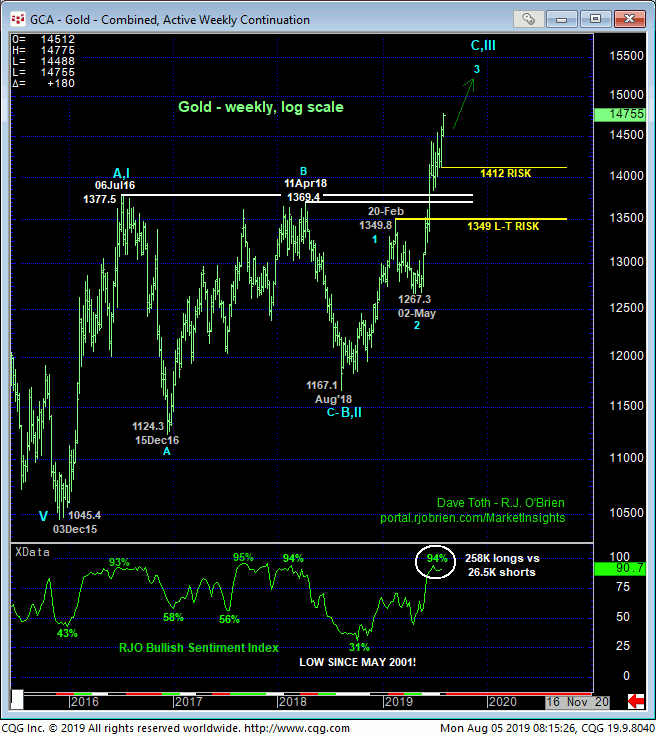
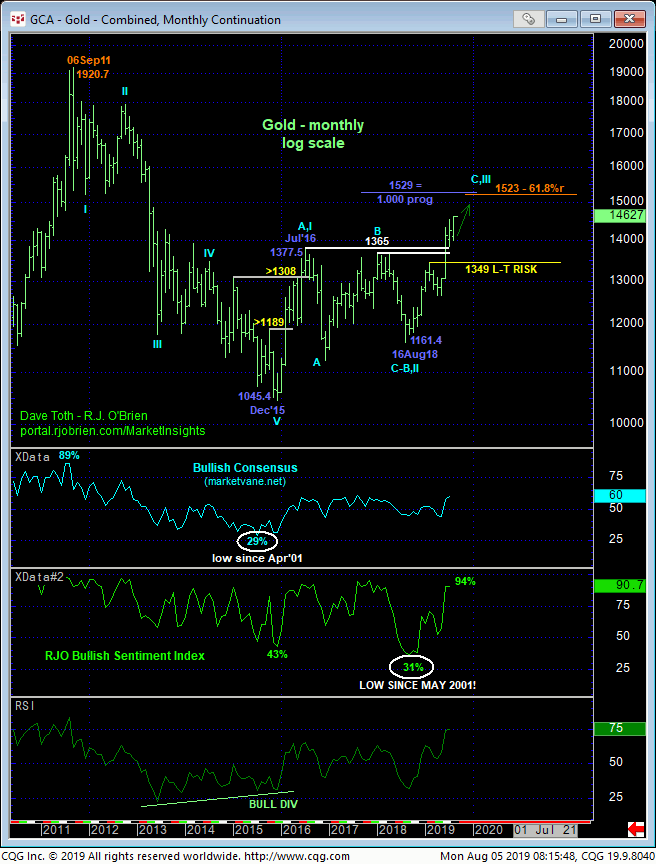
Only a glance at the weekly (above) and monthly (below) is needed to see that the trend is up on all scales and that the market has achieved new highs for the 3-1/2-YEAR bull trend from Dec’15’s 1045 low and the highest levels since May 2013. Former 1375-to-1350-area resistance from Jul’16 until Jun’s bust-out above it defines this area as a huge new support condition this market is required to fail below to threaten the secular bull.
As for upside potential, it is indeterminable and potentially extreme. The ONLY levels that exist above the market now are those “derived” from past data, levels like imokus, Bollinger Bands, channel lines and progressions, NONE of which have ever proven reliable in trying to divine resistance in such a clear and present uptrend. The only levels of any technical merit currently exist only BELOW the market in the forms of prior corrective lows and former resistance-turned-support. And until or unless the market weakens below such levels, the trend is up and should not surprise by its continuance or acceleration.
We’ve noted a pair of Fibonacci progression and retracement relationships in the 1525-area that are interesting because of their close proximity to each other. But these vaunted Fib relationship won’t be considered any more important than any other lowly derived technical level unless accompanied by a confirmed bearish divergence in momentum. And again, such mo divergence requires a failure below a prior CORRECTIVE LOW, a condition we can only address if/when the market presents it. Currently, the tightest such corrective low and risk parameter is at 1448.8.
These issues considered, a full and aggressive bullish policy and exposure remain advised with a failure below 1448.8 required for shorter-term traders to step aside and commensurately larger-degree weakness below 1412 for long-term players to take defensive steps. In lieu of such weakness the trend is up on all scales and expected to continue and perhaps accelerate straight away.