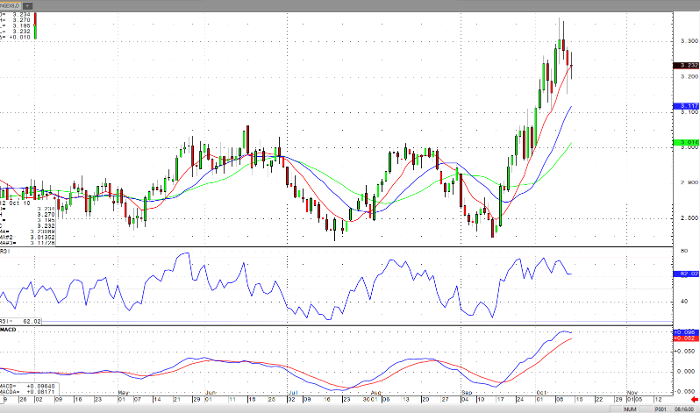
November’s Natural Gas is trendless, with a price range between $3.100-3.300. A close beneath $3.100 should take the cost down to the next trading range. Conversely, a close above $3.300 should take us higher, but today’s candle gives no clue to direction yet. Support is around $3.109 and resistance is near 3.306. Momentum studies are turning over but are at mid-levels, so they are no help as to direction either. Moving averages are looking up. Staying on the sidelines in cash might be the way to go.
Another hurricane, Michael, came and went quickly. In its wake, over 1 million people were left without power. Michael ran across the Carolina’s too adding to their devastation too. Due to the widespread loss of power, usage was down well under the averages putting a little rise in prices. This week with warmer temps predicted, gas might be the next commodity to correct and get even more affordable.
Natural Gas Nov ’18 Daily Chart


