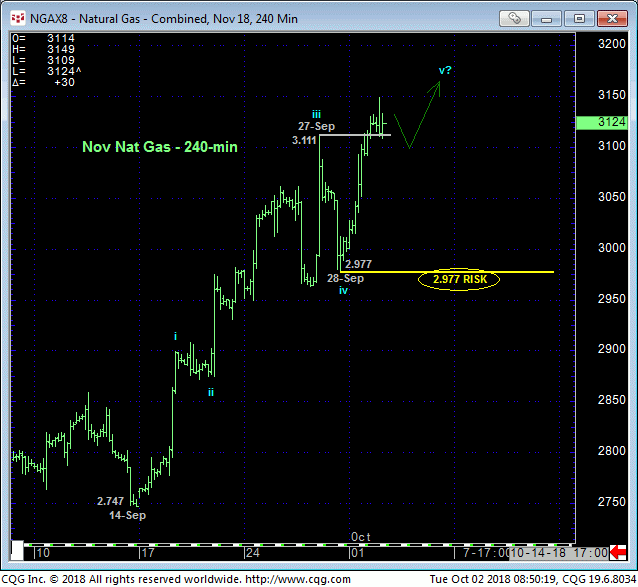
Yesterday and overnight’s recovery above last week’s 3.111 high doesn’t look like that big a deal in the 240-min chart below, but we’ll get to the long-term bullish ramifications below. We begin with this mere 240-min chart to show that this resumed strength leaves Fri’s 2.977 low in its wake as a relatively minor but crucially important corrective low that now serves as our key long-term risk parameter to a bullish count that warns of huge upside in the weeks and months ahead.


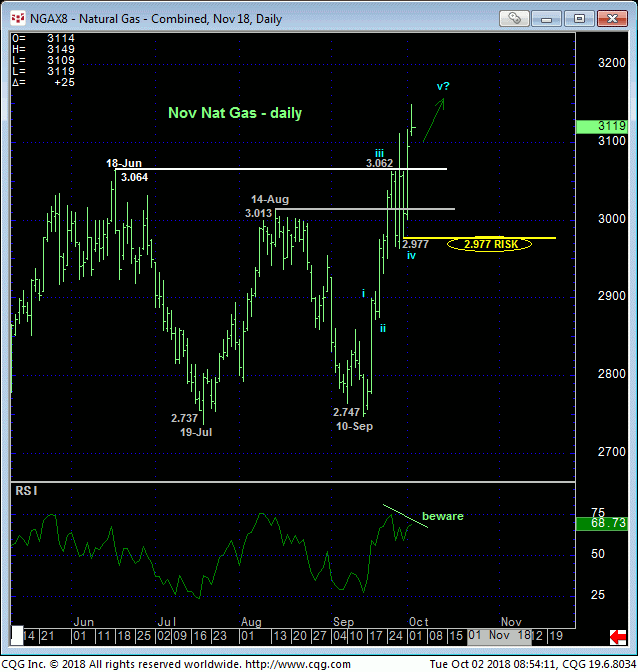
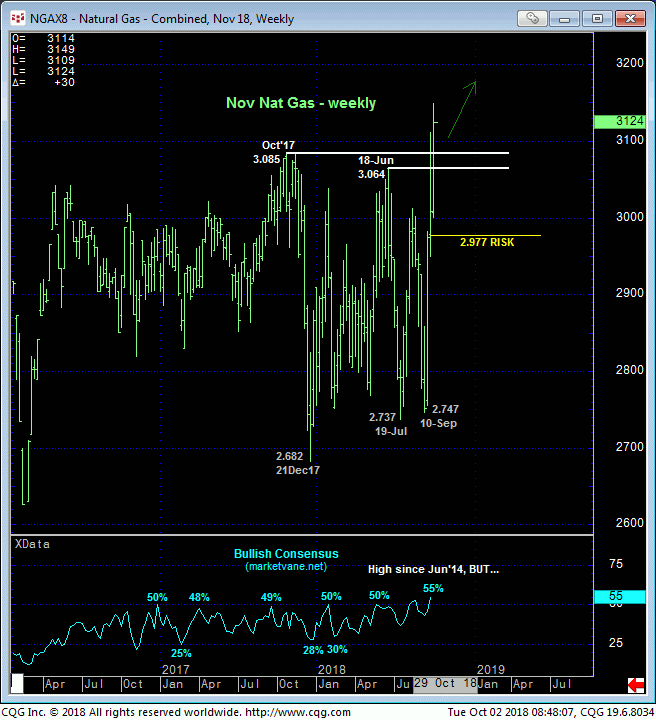
The daily (above) and weekly (below) charts of the Nov contract show the past few days’ breakout above not only the past quarter’s 3.01-to-3.06-area resistance, but also Oct’17’s 3.085 high that defined the upper boundary of a lateral range that dates from May 2016. This breakout exposes the very long-term trend as up and requires a failure below at least 2.977 to threaten a bullish count that could mean steep gains for months ahead. Indeed, this market can now LOOK DOWN on almost 2-1/2 YEARS of now-former resistance that should provide tons of new support ahead of any broader bullish count. And under these circumstances the fact that the current 55% reading in the Bullish Consensus (marketvane.net) is the “highest since Jun’14” means nothing until and unless the market fails below at least 2.997.

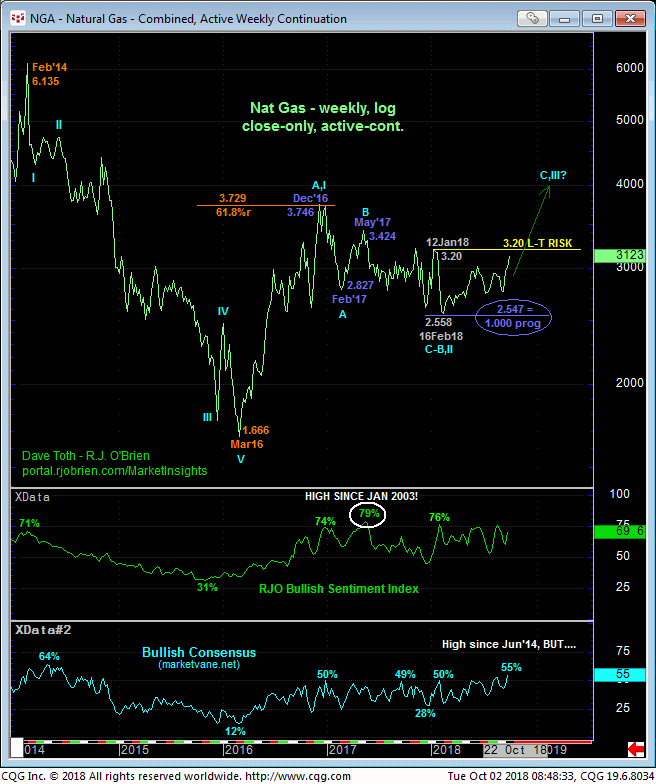
Moving to a weekly log close-only chart of the most active futures contract, 12Jan18’s 3.20 corrective high remains as the lone hurdle to a very bullish count that contends the entire Dec’16 – Feb’18 decline is a textbook 3-wave and thus (B- or 2nd-Wave) corrective affair that warns of a (C- or 3rd-Wave) resumption of 2016’s major rally that preceded it. Such a count would call for a sharp, extensive rally similar to that 2016 rally that would project to levels well above 4.000 and possibly even above 5.000!
These issues considered, traders are advised to move to a new bullish policy and first approach setback attempts to 3.065 OB as corrective buying opportunities with a failure below 2.977 required to negate this call and warrant its cover. In lieu of such sub-2.977 weakness further and possibly steep, accelerated gains that warn of a long, cold winter with former 3.08-to-3.02-area resistance considered key new support.


