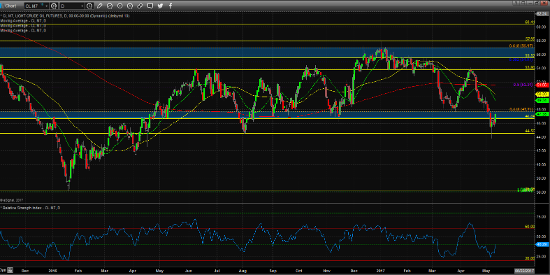
Crude oil markets have been under pressure since mid-April amid rising US production and talk of OPEC’s inability to extend production cuts. The recent sell-off thus far in May has many participants on edge as the oil market is flirting with a technical breakout from the extreme range low of 44.56 made on August 2, 2016. Despite an intra-day break below this figure, the market was unable to produce a close below 44.56, and has since found renewed buying interest down at these levels. This morning’s EIA report showed a draw in crude oil inventories to the tune of 5.2 million barrels. Distillates and Gasoline inventories also showed a draw, temporarily assisting crude oil prices which have been laboring over the past few weeks. Today’s action produced a corrective bounce into an area of structural significance from 46.69 – 47.71 and, if prices are able to produce a close above 47.71, a case could be made for continuation of the range-bound trading stage for crude. However, in light of recent downside momentum and increasing US production, many traders are beginning to question whether or not the recent trading range in oil is going to hold, or if oil is gearing up for a sustained move lower. It seems as though this theory has been temporarily put on “hold” as today’s strength helped oil priced rebound back into its current consolidation range.
The RSI indicator recently put in a swing low close to the 20 level, which is typically indicative of an oversold condition in a bearish market environment. The recent bounce has encouraged optimism of further gains; however, additional technical resistance can be seen initially around 51.34, where a 50% fibo retracement currently aligns with the 200-day SMA, both coming into play right around the 51.34 – 51.56 area. Above here, the recent peak around 53.80 will likely be the next upside target for traders. If today’s bounce proves to be short-lived, a confirmed close below 44.56 could set the stage for further declines as there is not much technical structure to support prices until roughly 41.50, and below there, the 36.20 swing low from early 2016.
In light of the recent supply draw in oil, I expect oil prices may continue to “churn” sideways between 46.69 and 51.50 in the near term. Market participants are encourage to continue monitoring key S/R levels and expect sideways, choppy trading conditions until a confirmed directional breakout is produced.
Jun ’17 Crude Oil Daily Chart


