Gold, Daily, Bullish

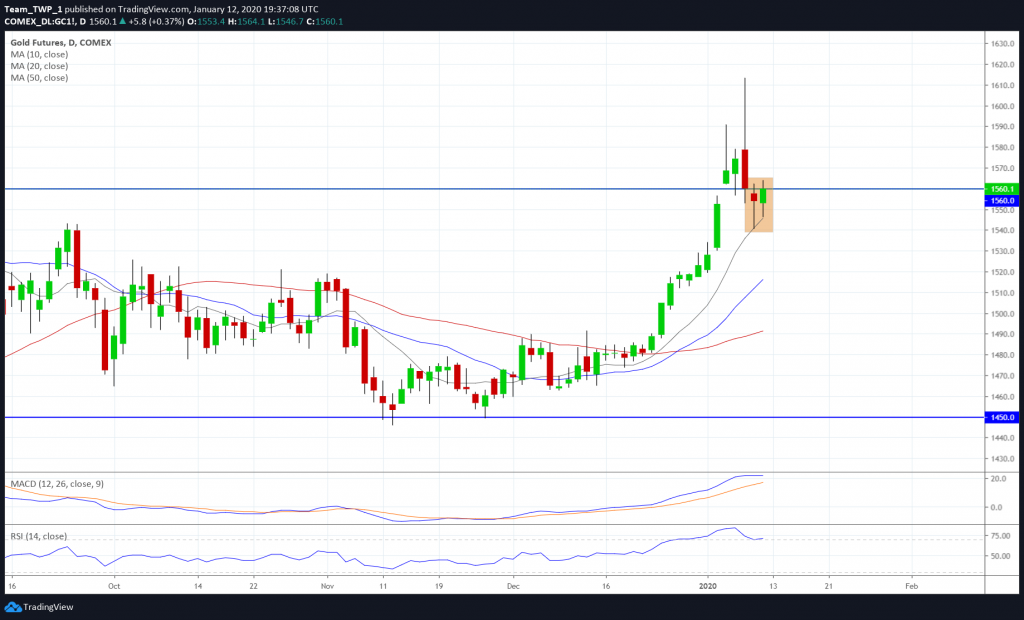
Gold has an up-trending Monthly, and Daily chart, although it should be noted that the Weekly chart recently produced an indecision candle as a reaction to US/Iran tensions at a key level of 1,560.
However, the Daily chart has nevertheless produced a small series of bullish candles at this level, which overlaps an area of equilibrium, and indicates a likelihood of attempting another move to the upside.
There is little significant resistance above this level, and price is otherwise trending in an optimal fashion.
Traders may consider an entry above the high of the highlighted green candle (1,564.1), only so long as price does NOT break the low of this candle first. The low of the previous candle, included within the highlighted area, could be considered as the swing-low of price here and may offer a valid stop-loss placement below its low of 1,541.
Dow Jones, Weekly, Bullish

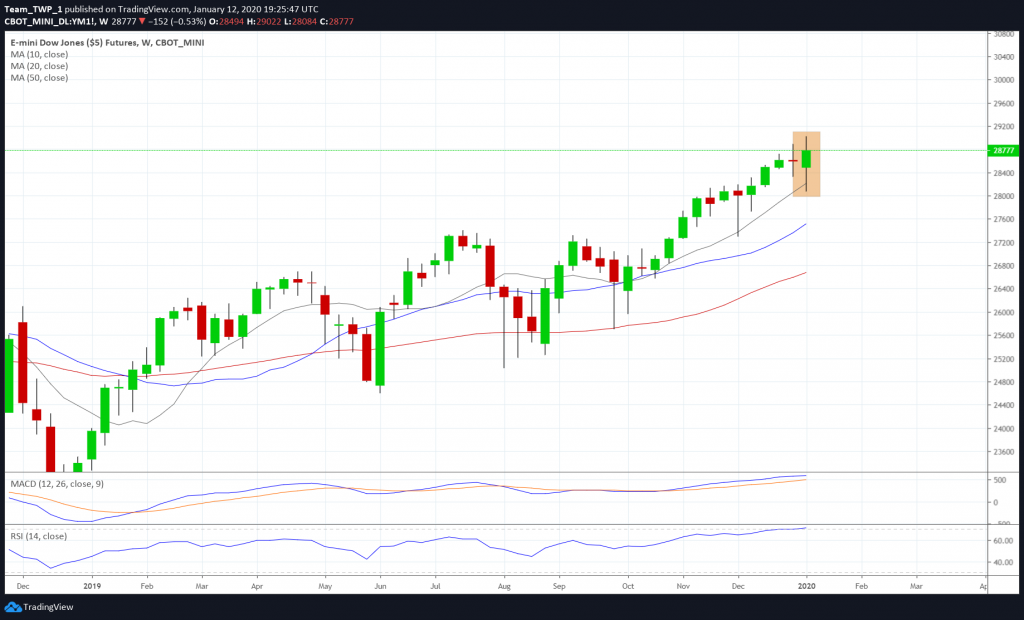
The Dow Jones Monthly, Weekly and Daily charts are all up-trending strongly with higher-highs and higher-lows, and this is also demonstrated in the 50, 20, and 10 simple moving averages trending upwards and fanning outwards.
The momentum indicators below support this bullish sentiment as they are both also angling higher.
The weekly chart has recently closed as it connected with the 10 moving average and represents a possible bullish setup.
Traders may consider long opportunities on the break of the high of this candle this coming week, with a stop-loss either below the low of the same candle or looking to lower timeframes for a tighter stop location.
NB. Should price fall below the low of this candle first (before breaking the high), the setup is negated.
The high of the candle is at 29,022, and the low at 28,084.
Since this instrument is creating new highs, a trailing stop-loss approach could reduce risk significantly.
Live Cattle, Daily, Bullish

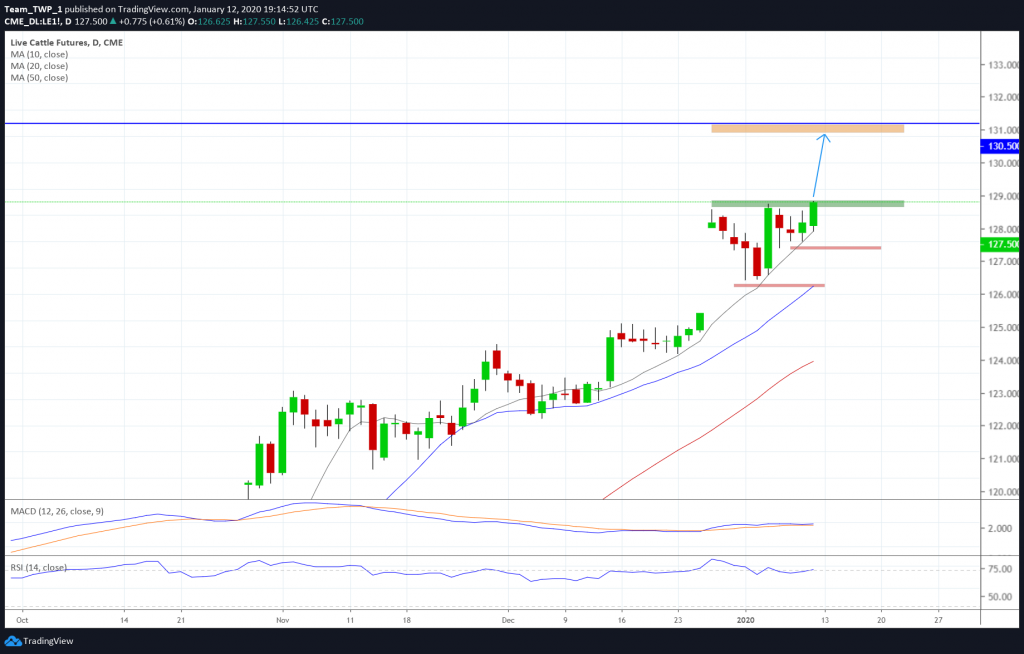
Live Cattle has been trending in an optimal fashion for some time now. The Monthly, Weekly and Daily timeframes all have strong uptrends with higher-highs and high-lows.
The momentum indicators have started to trend upwards, supporting a bullish move.
Price action is currently forming a bullish breakout pattern through the green-coloured zone highlighted in the chart @ 129.00
The next significant resistance level in blue, is at 130.50.
The gold-coloured zone highlighted just below this resistance level is a potential area for price to reach, and where possible profits lie.
Two areas highlighted in red represent possible stop-loss options.

