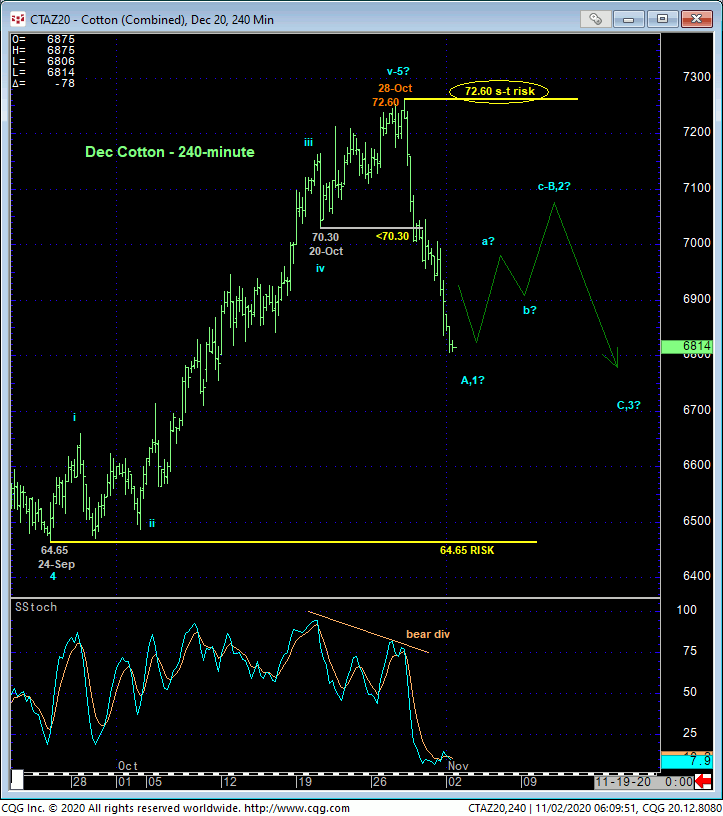
In last Wed’s Technical Webcast we discussed that day’s short-term momentum failure below 20-Oct’s 70.30 smaller-degree corrective low that allowed us to identify last week’s 72.60 high as the END of the rally from 24-Sep’s 64.65 next larger-degree corrective low. Per such, that 72.60 high serves as our new short-term risk parameter from which non-bullish decisions like long-covers and cautious bearish punts can now be objectively based and managed.
We also established that this short-term momentum failure was NOT of a scale sufficient to conclude the end of this year’s major reversal from 02-Apr’s 48.35 low. HOWEVER, for reasons we’ll discuss below, we believe the risk/reward merits of a continued bullish policy for even long-term players have become questionable enough to warrant moving to a neutral/sideline position.
Before addressing these issues however, we’d like to remain traders of our three reversal requirements, arguably none of which have been satisfied on a scale commensurate with concluding the end of a massive 7-month, 50% rally:
- a confirmed bearish divergence in momentum of a scale sufficient to break the major uptrend
- proof of trendy, impulsive 5-wave behavior down and, most importantly,
- proof of labored, corrective 3-wave behavior on a subsequent recovery attempt.
There is no question whatsoever that this market has confirmed a bearish divergence in mo, but not of a sufficient scale to break the 7-month uptrend. The relapse from last week’s 72.60 high detailed in the 240-min chart below looks to be unfolding in a pretty impulsive manner, so perhaps this requirement is satisfied. But we’ve always found a key to successfully navigating a reversal environment, especially if a market’s “early” in such a reversal process like this one arguably is, is proof of labored, 3-wave corrective behavior subsequent to the initial counter-trend sell-off attempt. This requirement clearly remains absent. If/when the market produces such a corrective-looking recovery, even on a shorter-term basis, we believe the risk/reward merits of a new bearish policy could be very favorable indeed.


Threats to the 7-month bull are indeed compelling however and include:
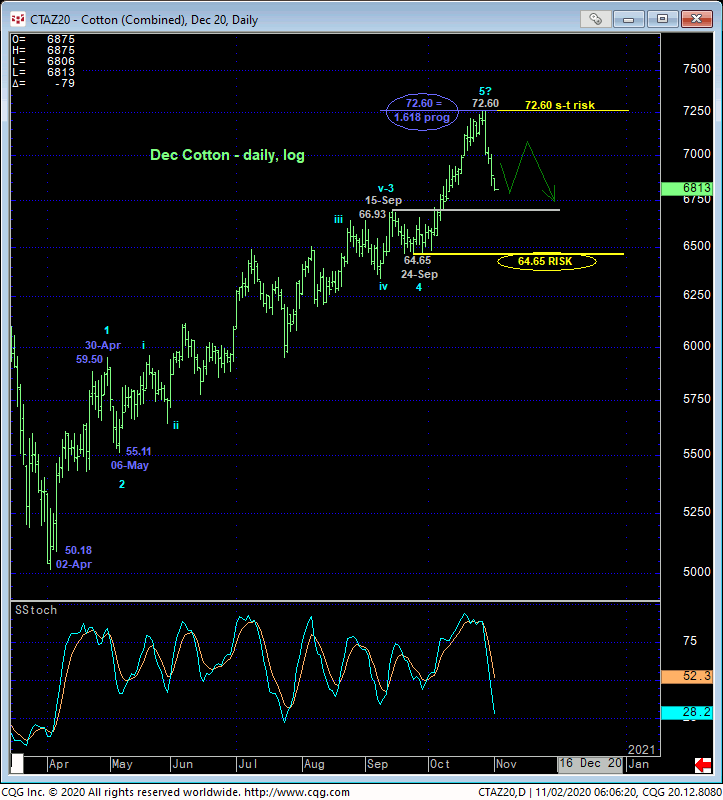
- an arguably complete (textbook even) 5-wave Elliott sequence up from 02-Ar’s 50.18 low in the Dec contract as labeled in the daily log chart chart above in which
- the rally from 06-May’s 55.11 2nd-Wave low spanned a distance exactly 61.8% longer (i.e. 1.618 progression) of Apr’s 50.18 – 59.50 1st-Wave
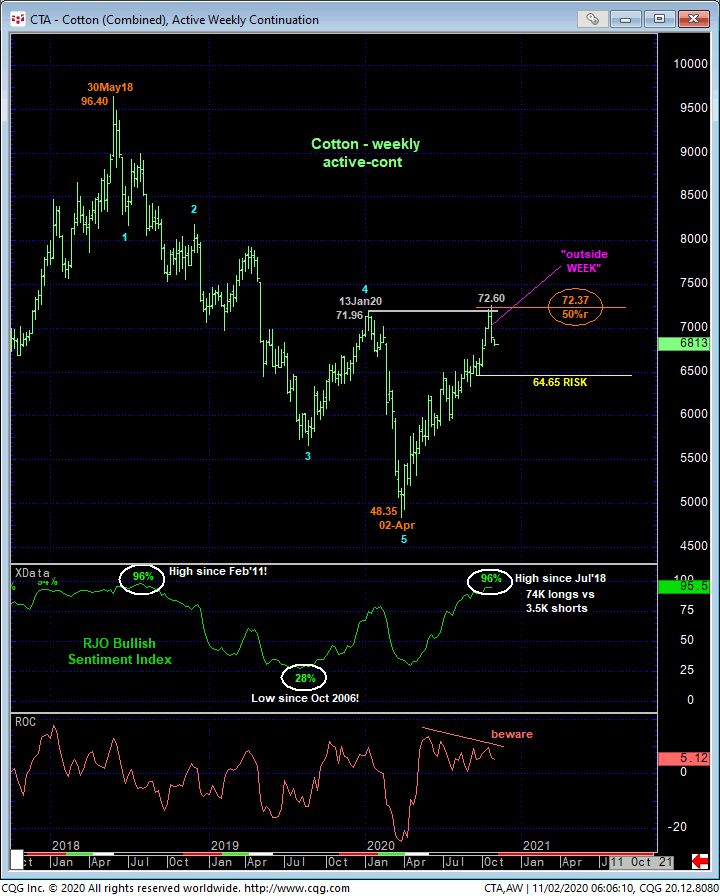
- the market’s rejection thus far of the area defined by this year’s 13-jan 71.96 high shown in the weekly active-continuation chart below that also includes
- the market’s rejection thus far of the (72.37) 50% retrace of 2018 – 2020 massive 96.40 – 48.35 bear trend
- historically frothy (96%) levels in our RJO Bullish Sentiment Index not seen since those that warned of and accompanied May’18’s major peak/reversal
- last week’s “outside WEEK” (higher high, lower low and lower close than the previous week’s range and close) and
- waning upside momentum on a major weekly basis (confirmed below 24-Sep’s 64.65 next larger-degree corrective low).
This is about as complete and unique and compelling a list of peak/reversal threat factors as we exists in the markets. The ONLY thing at this point is that this market has yet to exhibit to weakness on a scale sufficient to break this year’s major bull trend. It has even failed below an area of former resistance during Sep around the upper-66-handle-area, let alone confirm a bearish divergence in momentum below 24-Sep’s 64.65 larger-degree corrective low. What is HAS done however is reject/define a legitimate and objective high and risk parameter at 72.60 and produce enough threats against the bull to question the risk/reward merits of maintaining a bullish policy “up here” for even long-term players.
These issues considered, we’re advising long-term players to join shorter-term traders and move to a neutral/sideline policy and exchange whipsaw risk (above 72.60) for deeper nominal risk below 64.65. We will be watchful for proof of 3-wave corrective behavior on a subsequent recovery attempt in the days and perhaps weeks ahead to reinforce this peak/reversal count and present a risk/reward opportunity from the bear side that could be extraordinary. In the meantime, further lateral-to-lower prices are expected. And needless to say, a recovery above 72.60 mitigates this peak/reversal threat, reinstates the bull and exposes potentially steep gains thereafter.


