MAY SILVER
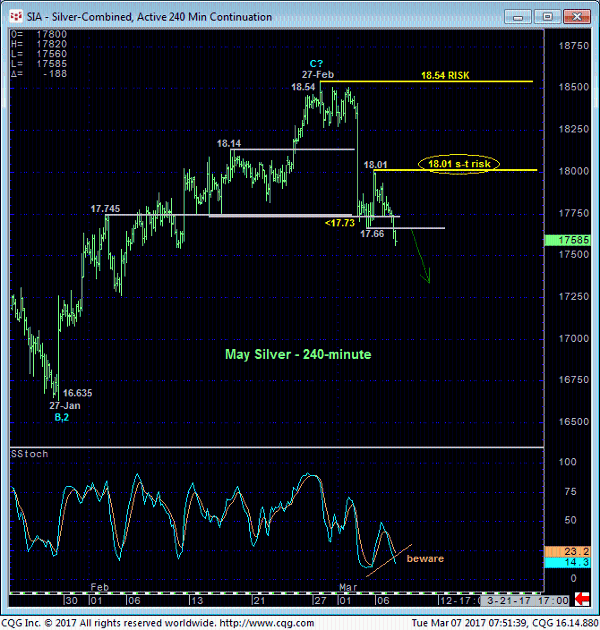
Today’s break below Fri’s 17.66 low reaffirms the developing peak/reversal threat initiated by Thur’s gross failure below former 18.14-to-17.74-range resistance-turned-support in general and below our short-term risk parameter at 17.73 specifically. This continued slide leaves Fri’s 18.01 high in its wake as the latest smaller-degree corrective high and new short-term risk parameter the market is now minimally required to recoup to arrest the slide and perhaps resurrect this year’s broader base/reversal threat. In lieu of at least such strength however and for additional facts we’ll discuss below, we believe the market has become vulnerable to a more extensive correction or reversal lower that warrants an immediate cover of all remaining bullish exposure.
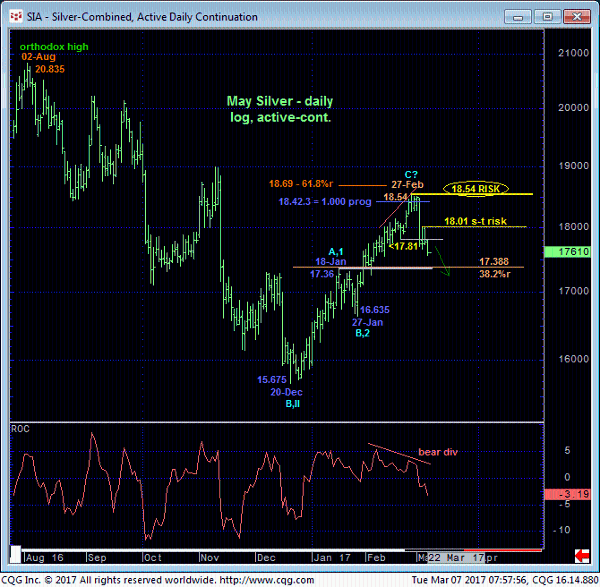
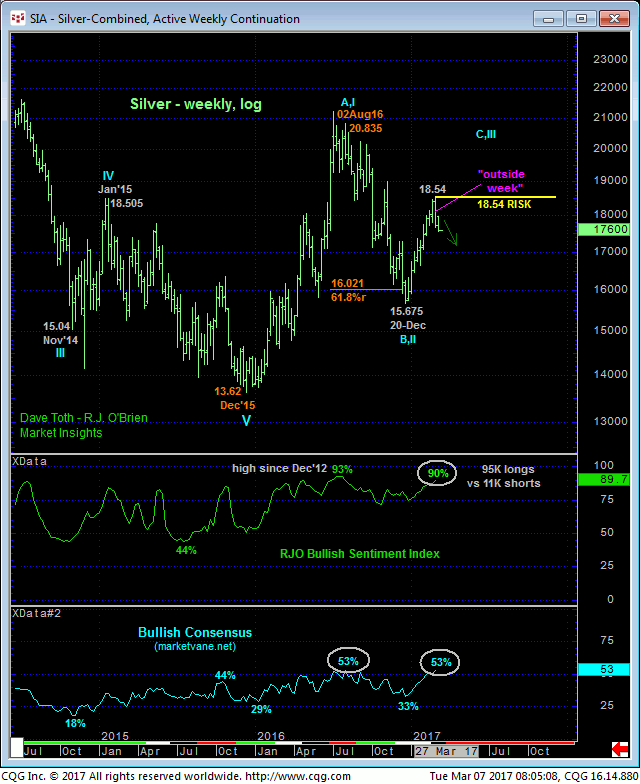
The daily log scale chart above and weekly log chart below show a number of technical facts that conspire against a bullish count, including:
- a confirmed bearish divergence in daily momentum below 17.81 that defines 27-Feb’s 18.54 high as one of developing importance and our new key risk parameter the market is now required to recoup to reinstate a broader bullish count
- the market’s rejection of a pair of Fibonacci retracement and progression relationships at 18.69 and 18.42 that sandwich 27-Feb’s 18.54 high
- last week’s “outside WEEK” (higher high, lower low and lower close than the previous week’s range and close) and, perhaps most indictingly,
- historically frothy levels of bullish sentiment not seen since those that warned of and accompanied Aug’16’s major peak and reversal.
Indeed, at a current 90% reading reflecting 95K Managed Money long positions reportable to the CFTC versus only 11K shorts, there is a tremendous amount of bullish exposure that is getting more costly and painful by the moment. Often times under such vulnerable sentiment conditions the market forces the capitulation of this exposure that only exacerbates that downside vulnerability.
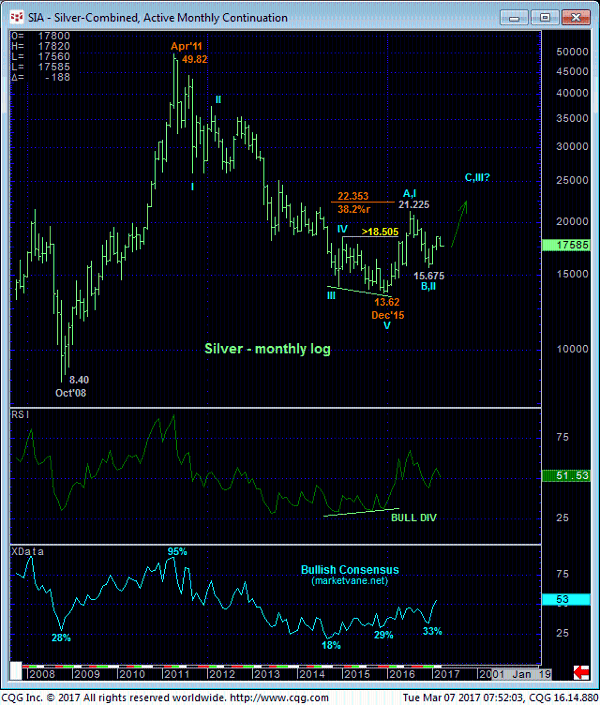
We remind traders that from an even longer-term perspective in the monthly log chart below, this current vulnerable condition could well remain a corrective subset within a major base/reversal environment from Dec’15’s 13.62 low that we’ve discussed often in our blogs since Jan’16. But until and unless this market recoups even a short-term risk parameter like 18.01, we believe the technical facts listed above warn of a correction or reversal lower of indeterminable and potentially extensive depth.
These issues considered, all previously recommended bullish exposure is advised to be covered (if it already hasn’t below 17.73) ahead of a move to a cautious bearish policy from the 17.65-level OB with strength above 18.01 required to threaten this new call enough to warrant a move to the sidelines. In lieu of such 18.01+ strength further and possibly accelerated losses should not surprise.
APR GOLD
The correlation between gold and silver, while far from perfect, is one of the better and more reliable positive correlation relationships across all of the commodity markets, so one is not likely to go somewhere where the other one isn’t. Clearly, the past week’s failure below our short-term risk parameter defined by 21-Feb’s 1226.8 corrective low defines 27-Feb’s 1264.9 high as one of developing importance and a new risk parameter from which non-bullish decisions like long-covers and cautious bearish punts can be objectively based and managed. The eventual magnitude of this high remains to be seem.
From a very, very short-term perspective today’s resumed slide leaves yesterday’s 1237.3 high in its wake as a very minor corrective high and a micro risk parameter from which non-bullish decisions like long-covers and cautious bearish punts can be objectively based and managed.
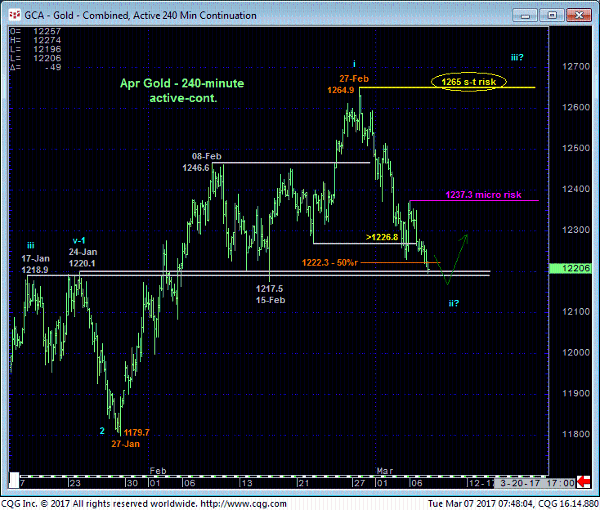
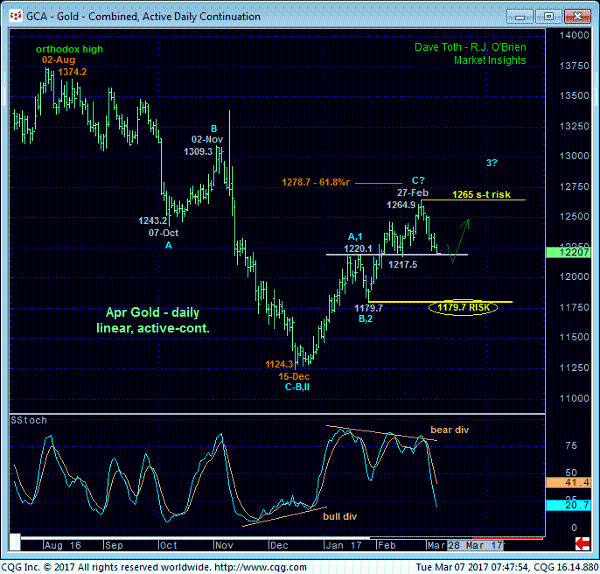
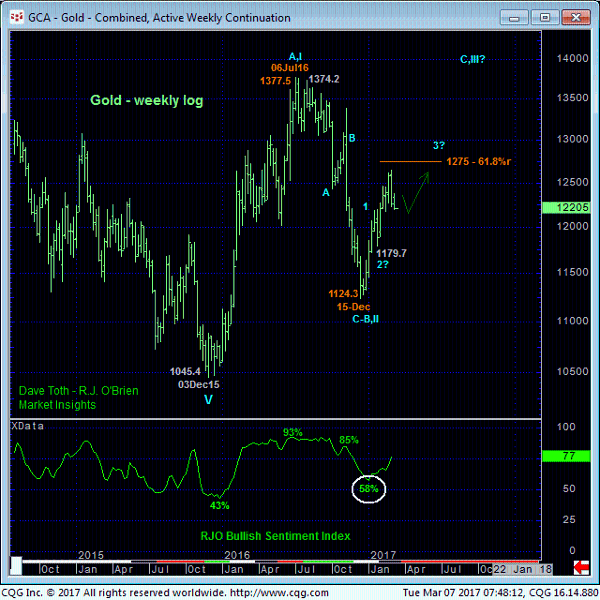
UNlike the silver market, sentiment levels in gold shown in the weekly log scale chart below are far from historically frothy. Also, while upside momentum has clearly waned over the past few weeks, the daily chart above shows the market thus far only pulling back to an area of key former resistance from the 1220-to-1217-range that now is considered a key support candidate within the past quarter’s uptrend. If there’s a place and time for the market to stem the current relapse, we would expect it to do so here and now. Micro strength above 1237.3 would be the first proof of such a prospect.
By the same token if this 1217-area DOESN’T hold, the market’s downside potential could be steep and in line with the vulnerability cited above for the silver market. These issues, shorter-term traders with tighter risk profiles have been advised to move to a neutral/sideline position following Fri’s failure below 1226.8. Longer-term players are advised to pare bullish exposure to more conservative levels and jettison the position altogether on a confirmed break below 1215.0 to circumvent the depths unknown of a larger-degree correction or reversal lower.
