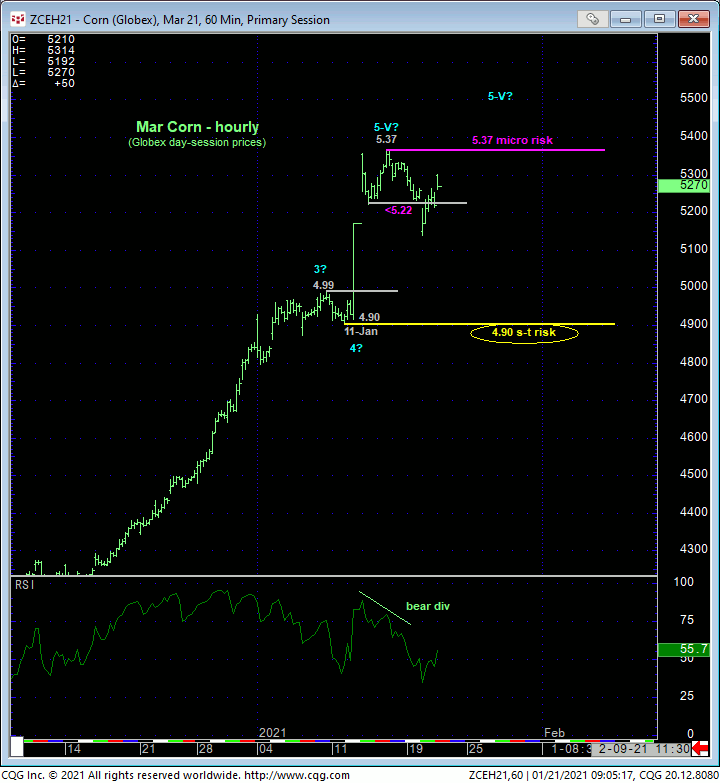
In yesterday’s Soybean and Bean Meal Technical Blog, we discussed very, very short-term bearish divergence in momentum that, while grossly insufficient to conclude a larger-degree correction or reversal, sufficed in identifying admittedly very minor highs from which to beware the prospective start of more corrections or reversals lower that could become more protracted in scope. Looking at the hourly chart of corn below, here too, yesterday morning’s slip below an extraordinarily short-term corrective low at 5.22 from 13-Jan confirms a bearish divergence in momentum. This short-term mo failure defines 14-Jan’s 5.37 Globex day-session high as the END of at least the portion of the major bull from 11-Jan’s 4.90 next larger-degree corrective low. And as such, this 5.37 high serves as a micro but objective risk parameter from which non-bullish decisions like long-covers and cautious bearish punts can be objectively based and managed. A recovery above 5.37 nullifies this bearish divergence, chalks up the slip to yesterday’s 5.14 low as yet another correction and reaffirms the secular bull market ahead of further and possibly accelerated gains.


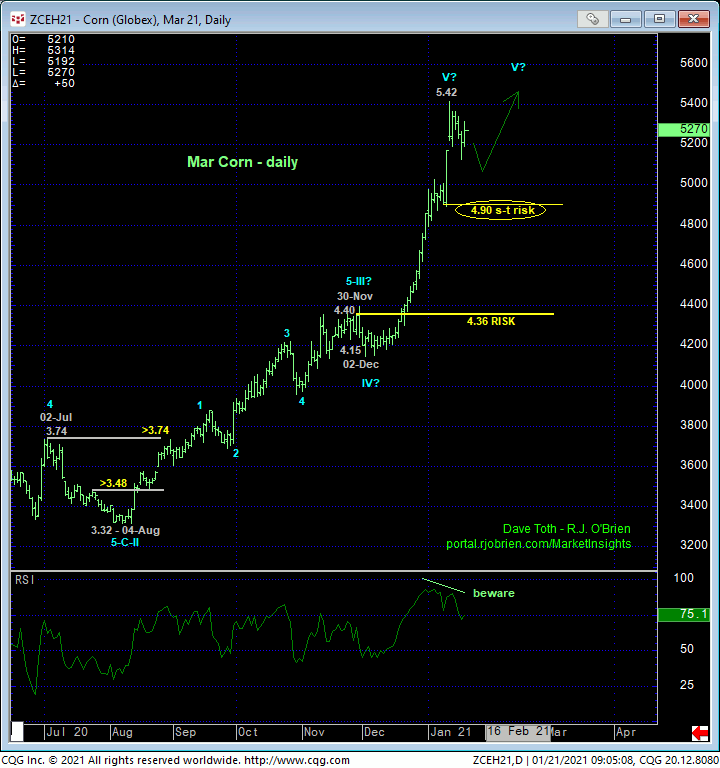
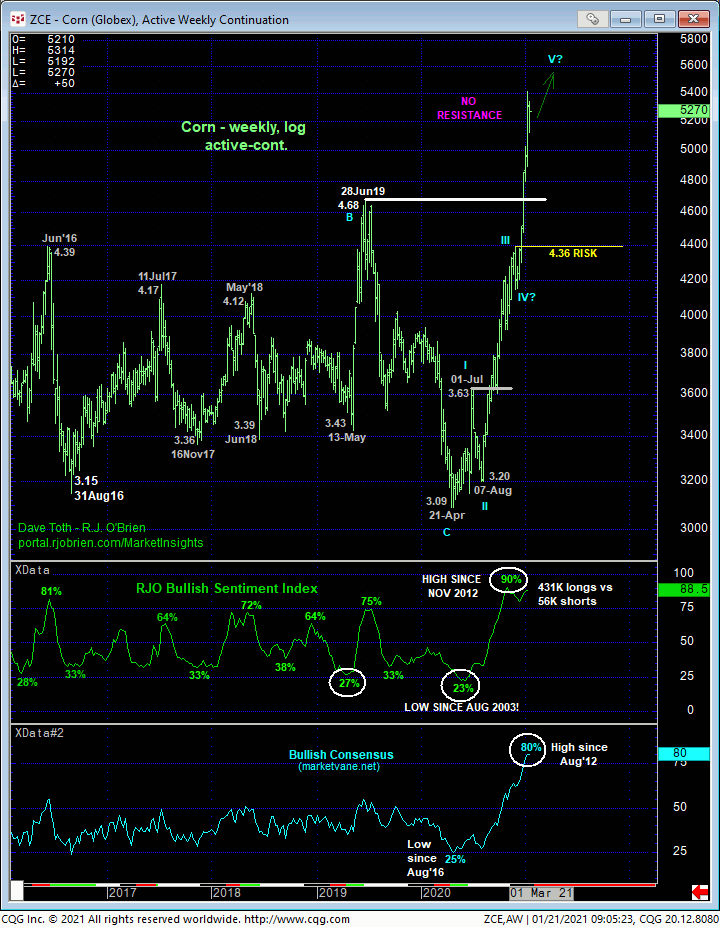
Taking a step back and looking at the daily chart above and weekly log chart below, CLEARLY, this week’s minor slip is of a grossly insufficient SCALE to conclude anything more than yet another correction within the secular bull trend. On even a short-term scale, let alone anything broader, a relapse below at least 11-Jan’s 4.90 next larger-degree corrective low remains minimally required to even defer the bull, let alone threaten it.
The resulting challenge is that “up here” at such lofty levels, a relatively minor percentage setback is nominally steep. A “short-term” risk parameter at 4.90 is roughly 40-cents away from current 5.28-area prices. And even then, a sub-4.90 failure would only allow us to conclude the end of the uptrend from 02-Dec’s 4.15 low, NOT the secular bull trend from 21Apr20’s 3.09 low. To truly threaten the massive 75%, $2.33, 9-month uptrend, commensurately larger-degree weakness below at least former 4.36-area resistance-turned-support from Nov remains arguably required.
As giving back such a large amount of profits simply isn’t practical for even long-term commercial players after such a huge, relentless rally that left little in the way of former battlegrounds that now can be considered risk parameter failure points, a viable alternative to managing bull risk “up here” is to acknowledge and accept whipsaw risk (back above whatever high is left in the wake of a shorter-term mo failure like yesterday’s) in exchange for deeper nominal risk on at least a portion of one’s long position. For instance, paring or neutralizing bullish exposure around current 5.28-area levels and getting whipsawed above 5.37 where the position would be repurchased may be a preferred risk/reward avenue to waiting for commensurately larger-degree weakness below 4.90 or 4.36 to get out. Trading decisions away from these specific technical levels are subjective and/or emotional and outside the bounds of technical discipline.

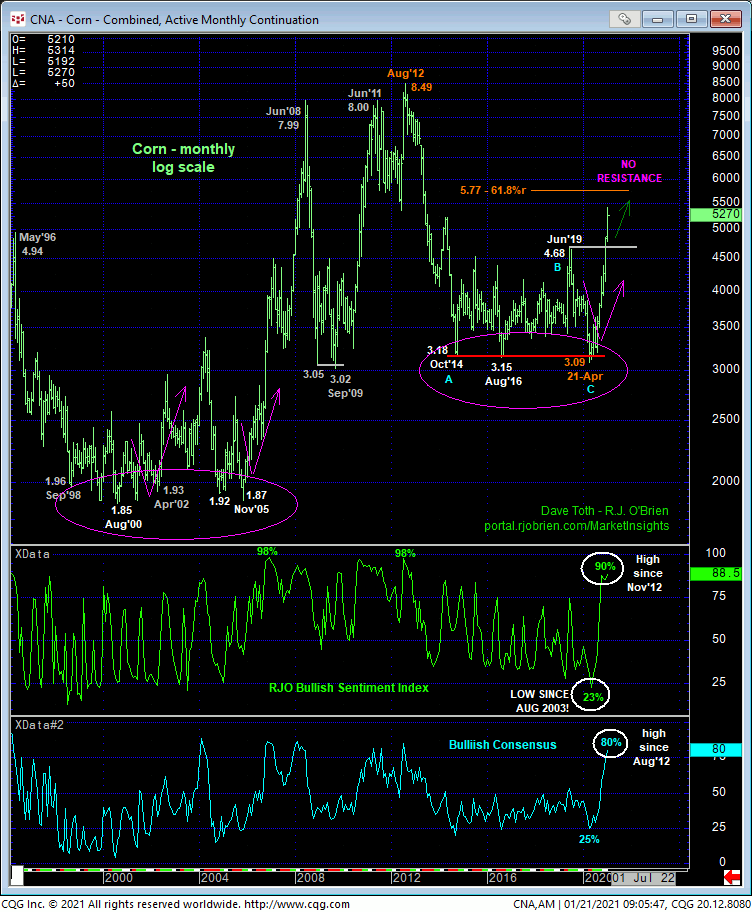
In addition to almost any-sized momentum failure “up here”, understandably historically frothy bullish sentiment/contrary opinion levels can easily magnify moves, especially to the downside. Indeed, only a glance at the weekly (above) and monthly (below) log scale charts is needed to see that EVERY major peak/correction/reversal environment stems from precisely the type of frothy sentiment levels currently afflicting this market.
These issues considered, shorter-term traders are advised to pare or neutralize bullish exposure at-the-market (5.27) with a recovery above 5.37 required to negate this call, warrant its cover-&-reversal and reinstate the secular bull. Longer-term players are OK to maintain a bullish policy and exposure with a failure below 4.90 required to warrant moving to a neutral/sideline position in order to circumvent the depths unknown of a correction or reversal lower that could be major in scope (at least on a nominal arithmetic basis). Needless to say, a recovery above 5.37 reinstates the secular bull ahead of further and possibly steep gains as the monthly log chart below shows no levels of any technical merit shy of 2012’s 8.49 all-time high. In effect and with the exception of an extraordinarily minor high at 5.37, there is no resistance to this market.


