Posted on Apr 04, 2023, 08:19 by Dave Toth
This morning’s bust out above the past three weeks’ resistance ranging from last week’s 1005 high to 13-Mar’s 1012 high confirms our bullish count discussed in Thur’s Technical Webcast that concluded mid-to-late-Mar’s sell-off attempt was a 3-wave and thus corrective affair. As a result of this continued strength, the 240-min chart below shows that the market has identified smaller-degree corrective lows at 983 and 959.2 that it is now required to fail below to threaten and then negate a more immediate bullish count. Until and unless such weakness is proven, further and possibly accelerated gains are exposed straight away, with 983 and 959.2 considered our new mini and short-term parameters from which to rebase and manage the risk of an advised bullish policy and exposure.
Now-former 1012-to-1005-area resistance is considered new near-term support.
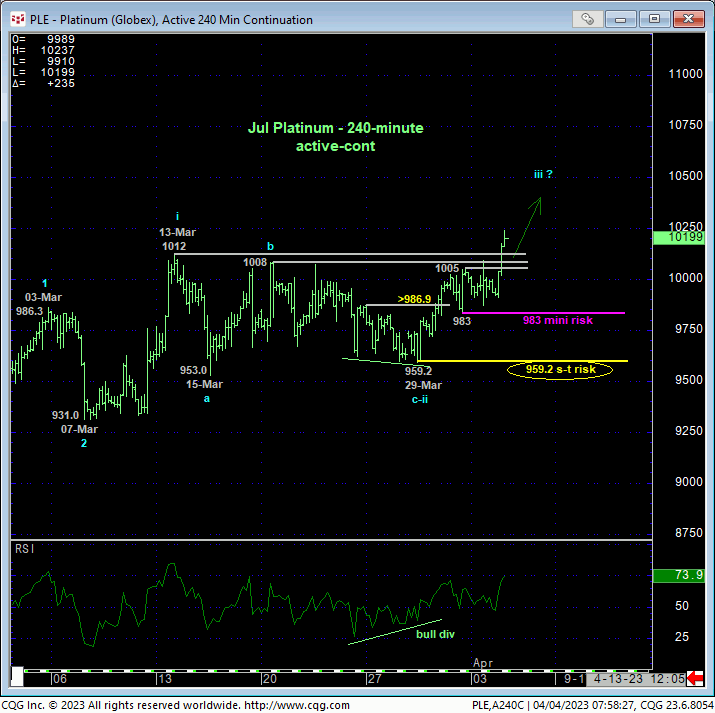
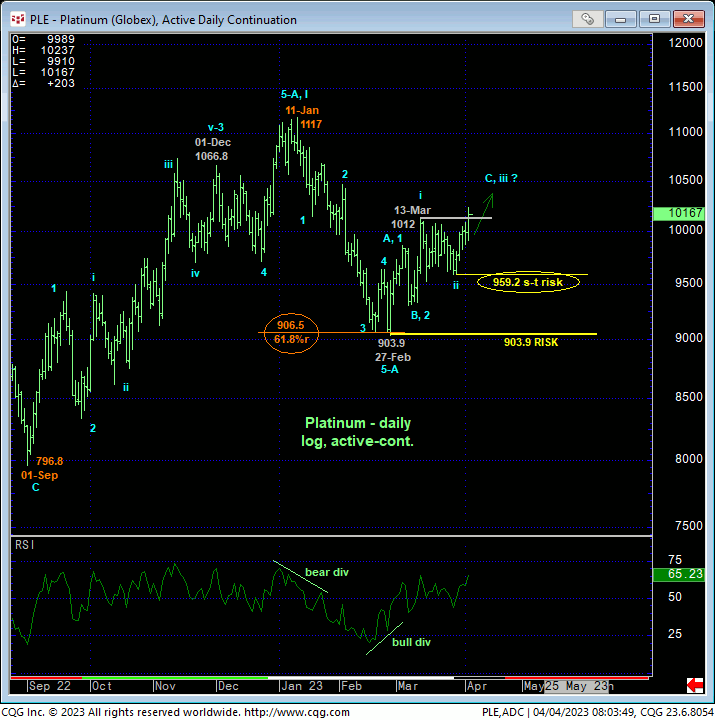
What’s important and opportunistic about today’s breakout above 13-Mar’s 1012 high is that it exposes an area totally devoid of any technical levels of merit shy of 11-Jan’s 1117 high. This doesn’t mean we’re forecasting a move to 1117, but it certainly does mean that until and unless this market confirms a bearish divergence in momentum below levels like 983 and 959.2 needed to derail this uptrend, the market’s upside potential is indeterminable and potentially extreme, including a run at or even through 1117.
Might the recovery from 27-Fenb’s 903.9 low be just a larger-degree 3-wave correction of Jan-Feb’s 1117 – 903.9 decline? Sure. But if this is the case, then somewhere along the line this market needs to arrest this recovery with a countering bearish divergence in momentum. And we will navigate such a count precisely around levels like 983, 959.2 and especially 903.9. Until and unless such weakness is proven, there’s no way to know that the current rally from last week’s 959.2 low isn’t the dramatic and directional 3rd-Wave of a resumption of the major bull trend from last Sep’s 796.8 low to new highs above 1117 following an exact 61.8% retracement of Sep-Jan’s rally.
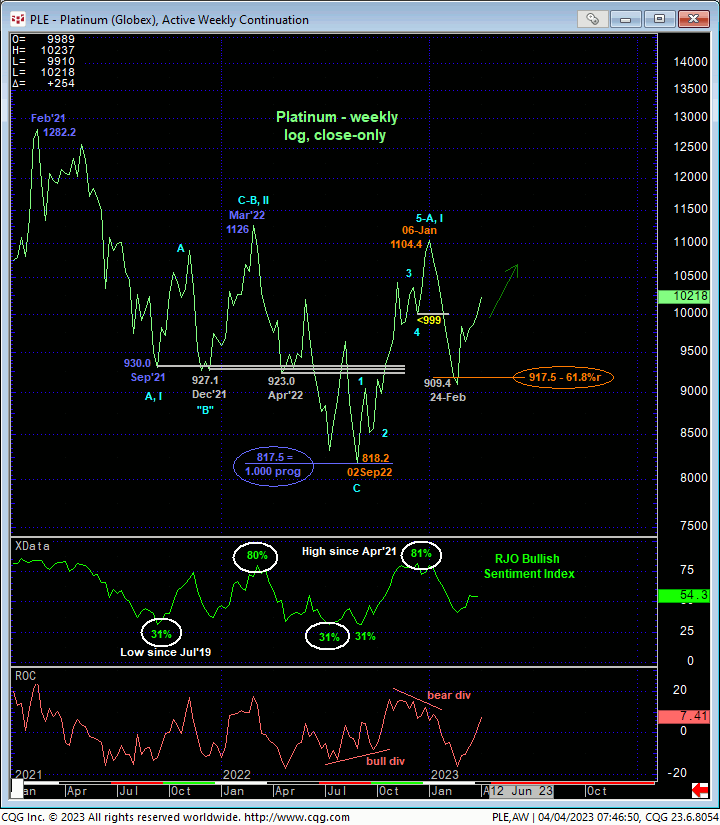
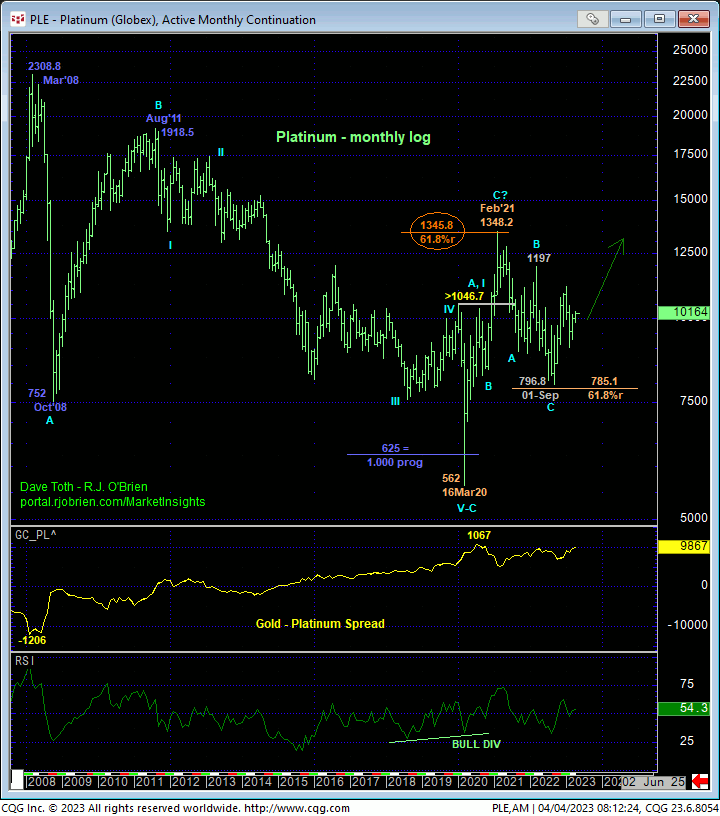
Finally and while the market remains mired in the middle of at least the past two years’ range and arguably a wild, volatile range that dates from late-2015 where aimless whipsaw risk may continue to rule, the importance of Sep-Jan’s recovery is that it renders the entire Feb’21 – Sep’22 sell-off attempt a 3-wave affair as labeled in the monthly log chart below. Left unaltered by a relapse below last Sep’s 796.8 low, this 3-wave decline may be considered a corrective event that warns of a resumption of 2020 – 2021’s uptrend that preceded it.
It may also prove important to a long position in platinum that the spread between gold and platinum remains at historic highs near and around $1,000. This suggests platinum is “cheap” relative to gold. COMBINED with the shorter-term strength detailed above, we believe this presents a favorable risk/reward opportunity from the bull side.
These issues considered, a bullish policy and exposure remains advised with a failure below at least 983.0 and especially 959.2 required to threaten and then negate this specific call and warrant its cover. Until and unless such weakness is proven, further and possibly accelerated gains straight away are expected.