Posted on Sep 15, 2023, 08:10 by Dave Toth
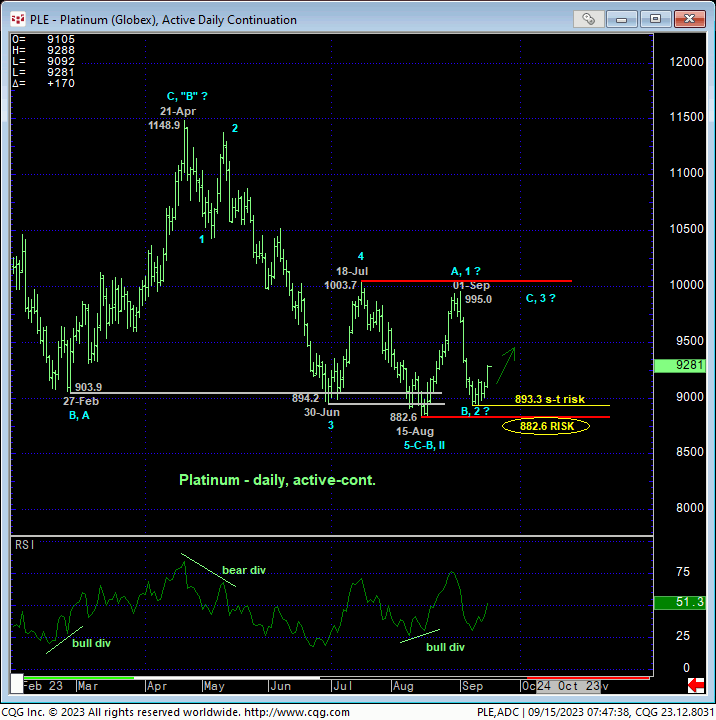
Overnight’s break above Tue’s 916.4 initial counter-trend high confirms our base/correction/recovery count introduced in Mon’s Technical Blog and defines 08-Sep’s 893.3 low as the end of the sell-off from 01-Sep’s 995 high. Especially stemming from the extreme lower recesses of the past 2-1/2-months range, we believe this market is now vulnerable to at least another intra-range recovery and quite possibly a major reversal higher. Per such, 08-Sep’s 893.3 low serves as our new short-term but key parameter from which the risk of a cautious bullish policy and exposure can be objectively based and managed.


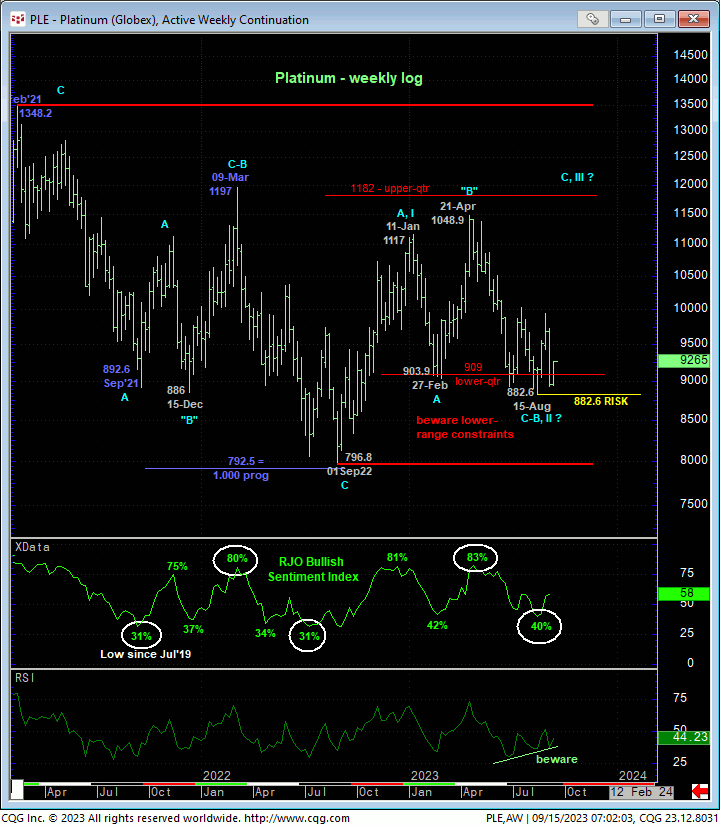
The daily chart above shows the market’s rejection, thus far at least, of the extreme lower recesses of the range that has constrained this market since at least late-Jun and arguably all of 2023. Adding to the compelling nature of this development, the weekly log chart below shows the market’s continued inability to make any headway into the lower-quarter of the past few years’ range, an area and condition that we always approach as a key support candidate. We believe this combination of:
- waning downside momentum on a longer-term basis
- established lows/support, and
- the recent return to relatively low levels in our RJO Bullish Sentiment Index
questions the risk/reward merits of a bearish policy and reinforces the risk/reward merits of at least a cautious bullish stance.

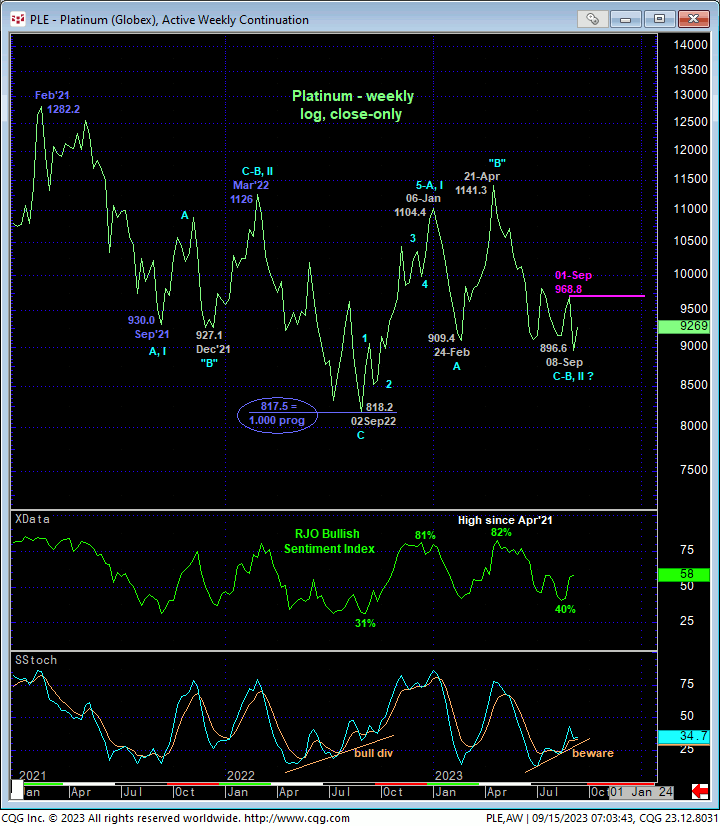
Lastly and even more intriguingly, the weekly log close-only chart below shows this entire year’s setback attempt from 06-Jan’s 1104.4 high as a prospective complete ‘irregular” 3-wave correction of Sep’22 – Jan’23’s initial 5-wave rally. This correction is “irregular” because the “B”-Wave posted a new but temporary high above 06-Jan’s 1104.4 start of the correction. And ALL of this price action from Sep’22’s 818.2 low comes on the heels of a textbook 3-wave decline from Feb’21’s 1282.2 high. Left unaltered by a relapse below Sep’22’s 818.2 low, the price action up from that low remains intact as a major correction or reversal higher that would warn of not only a resumption of Sep’22 – Jan’23’s uptrend, but also a recovery above Feb’21’s 1282 high!
Now, there’s no way in the world that we can conclude a $350+ move from this week’s meager pop. Commensurately larger-degree strength above at least Jul/Sep’s 995-to-1003.07-area resistance is required to reinforce such a broader base/reversal count. But we CAN conclude recent and pivotal developing support from the 893.3-to-882.6-range as THE area and condition the market needs to break to mitigate any base/correction/reversal count and expose a more protracted bear. Until and unless such weakness is proven, further lateral-to-higher, and possibly much higher prices should not surprise.
These issues considered, a bullish policy and exposure are advised with a failure below 893.3 required to negate this specific count and warrant its cover. In lieu of such weakness, further and possibly protracted gains are anticipated.


