Over the last week the markets have demonstrated increased volatility across multiple asset classes. And there’s no sign indicating the heightened volatility will be going away anytime soon.
The US is now the global epicenter for the COVID-19 infections rate, having surpassed China. As individual US states are considering more serious ways of imposing restrictions in order to reduce the infection rate, the ripple effect on productivity continues and so the economy is still slowing. March’s job report revealed a shocking 3.3 million unemployment claims, another US historical record.
The Senate has signed off a £2 trillion stimulus package, which may soften the economic situation for the foreseeable future, while the markets wait on signs of a potential vaccine.
In terms of trading opportunities, there are still some trends in place amongst the more volatile charts. Gold, which has often been a safe haven commodity, has begun to trend upwards, indicating increased bullishness. However, not all of the precious metals reflect this.
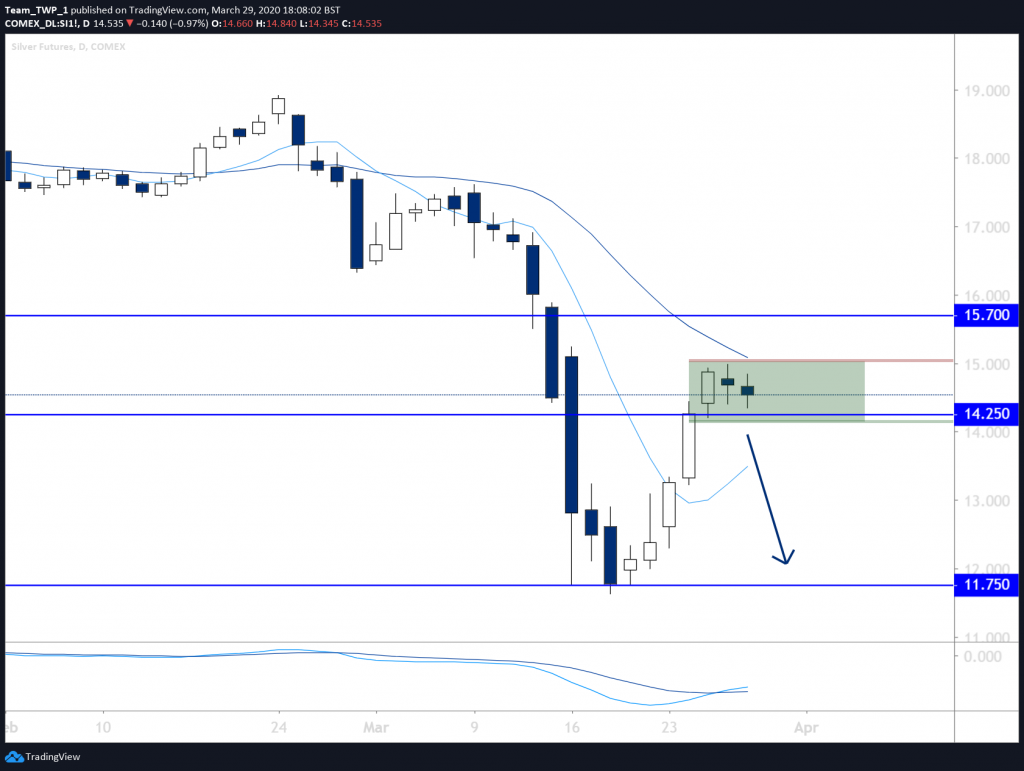
Silver, Daily, Bearish
Silver has been generally trending lower over several years, and during the week before last saw it almost touch $11.50, last seen in April 2009. Price was over-extended to the downside and finished this last week after a retracement back up to $15.
The moving averages (MAs) are bearish in both order and angle, with the momentum indicator also convergent with price.
Thursday and Friday produced bearish and indecisive candlesticks, which appears as a consolidation on the lower timeframes.
Should price break out of the consolidation to the downside, below $14.20, there may be a resumption of the Daily downtrend. A stop loss placed above the high of this consolidation at $15.00 may offer technical protection. The level of $15.00 may also offer added technical resistance.
The next major support level that price could target appears to be $11.75.
Taking profits if the moves are in the prevailing direction may further mitigate risk.
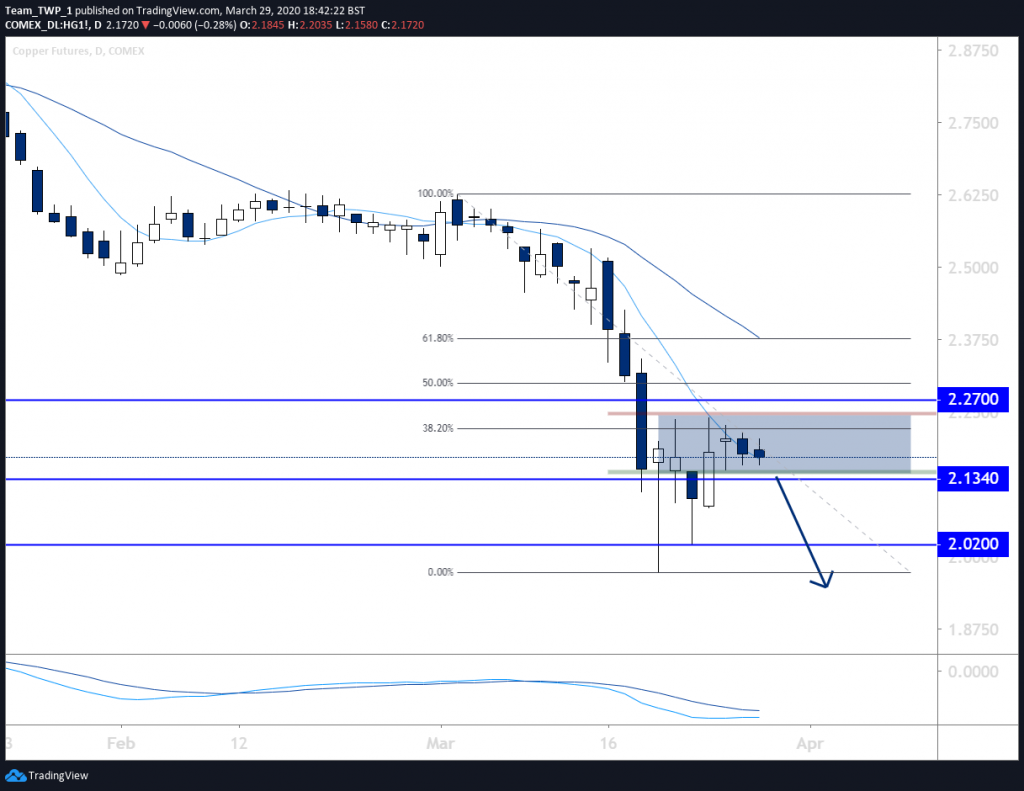
Copper, Daily, Bearish
Copper has been in a downtrend since 2018, displaying lower-highs and lower-lows on monthly, weekly, and daily charts.
On 19 March, lows were reached that have not been seen since January 2016.
The MAs and momentum indicator are all bearish, supporting the flow of price.
Similar to Silver, price has formed a small, tight consolidation. Copper also displays small inside candlesticks sitting at the declining 10 period MA as well as finding resistance at a 38.2% percent Fibonacci level.
Should price break lower than 2.1494, out of this tight grouping of candlesticks, it could indicate an intention to head lower as part of another extension of the downtrend.
Possible support lies below at 2.0200, offering more than a 1:1 reward to risk.
A stop-loss could be placed above 2.2395, and profits taken as price moves in favor of the trend in order to mitigate risk.
One consideration to take into account for both of these charts is that, should Gold become excessively bullish, it may lift other precious metals – even those that are not bullish individually. One potential approach could be to reduce capital exposure across both trades.
Risk management will be key, so the use of a stop-loss is imperative in order to protect capital exposure against unforeseen outcomes.