The past seven days have seen similar volatility to the previous week with the US Dollar Index orbiting the 100.00 level and the NASDAQ maintaining its strong hold on any bullish sentiment. Indeed, the US indices are technically leading the way to the upside and look potentially to maintain this uptrend as the week progresses.
States have been re-opening to various degrees, while keeping one eye on Covid-19 numbers. Coronavirus cases are now at 1.68 million, with 98,129 deaths, adding a few more fatalities since our previous commentary, but a slight drop compared to earlier weeks.
The government’s administrative focus appears to be on the coming election, with considerable debate on the merits of mail-in-voting being considered across the board should social-distancing still be a concern closer to the November event. Several states have already been safely employing this approach to voting for several years.
As we head into the final week of May 2020, key economic calendar news events to watch out for this week will include:
- Preliminary GDP Quarterly numbers – Thursday.
- Federal Reserve Chair Jerome Powell speaks – Friday.
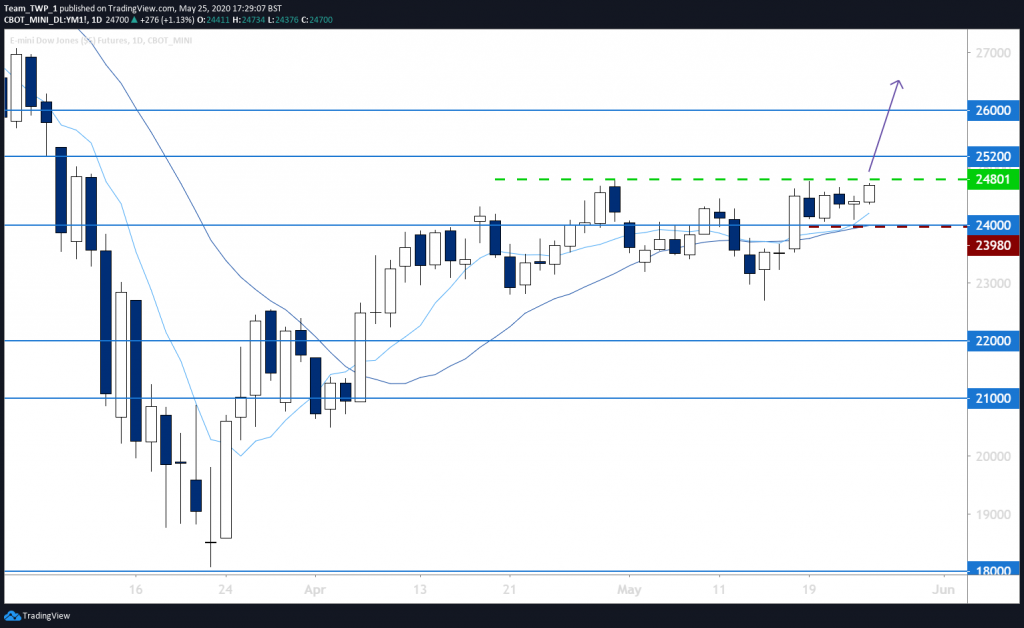
E-mini Dow Jones, Daily, Bullish
Although the monthly chart on the E-mini DJ shows no trend technically, having broken recent lows, the weekly and daily charts do present a more bullish potential uptrend in line with the NASDAQ, which is already trending to the upside.
Price has been testing resistance at 24,750 and appears to be intending to break out to the upside. Both the RSI and MACD momentum indicators are trending higher, supporting the bullish sentiment.
Price is close to the moving averages (MAs), indicating a good area of equilibrium to resume trending.
Should price break above 24,801, there may be an entry opportunity into a new extension.
Potential resistance could occur at the 26,000 level and it therefore may be worth taking partial profits ahead of this level. Conversely, should price unexpectedly drop below 24,000, it could be considered as renewed volatility and a stop-loss could help reduce losses.
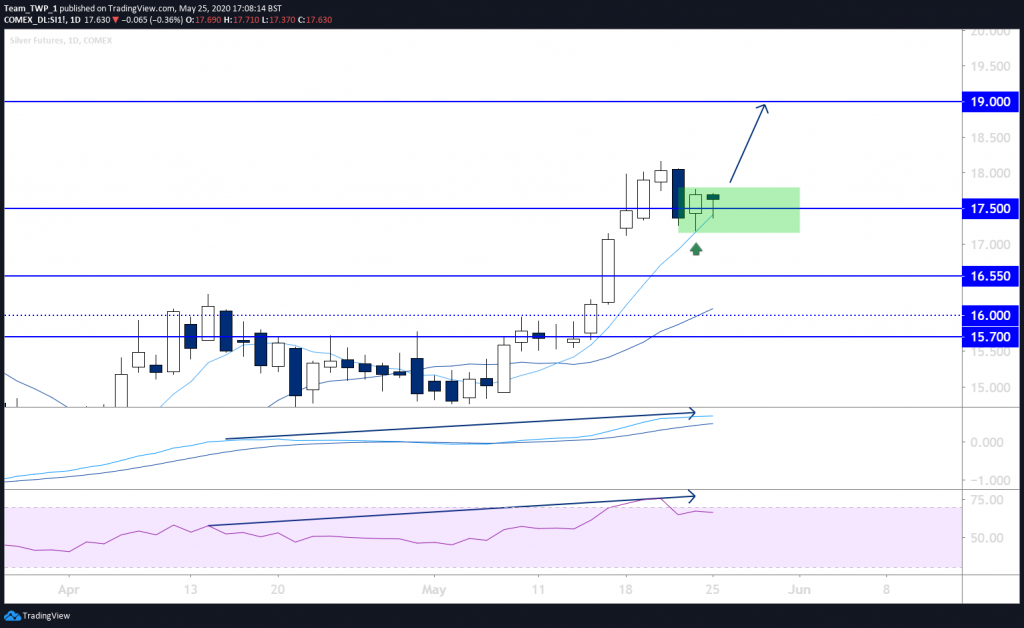
Silver, Daily, Bullish
Silver has not enjoyed the same bullish gains as Gold, technically or otherwise, until recently breaking out to the upside. The weekly chart does now have a confirmed uptrend with higher-highs and higher-lows.
While arguably overextended away from the 16.55 level, price has produced a small, bullish candlestick in the buy zone of the MAs, with both momentum indicators showing bullish, trending momentum as well.
Price may be getting ready to attempt the next leg up sooner rather than later.
An entry above the high of two recent daily candlesticks around 17.80, with a stop-loss below the low of Friday’s candlestick around 17.15, may offer an entry into the next leg if it occurs.
The level of 19.00 may offer significant resistance and taking partial profits ahead of this level could help reduce exposure.
Risk management will be key, so a stop-loss is imperative in order to protect capital exposure against unforeseen outcomes.