Posted on Oct 03, 2023, 09:06 by Dave Toth
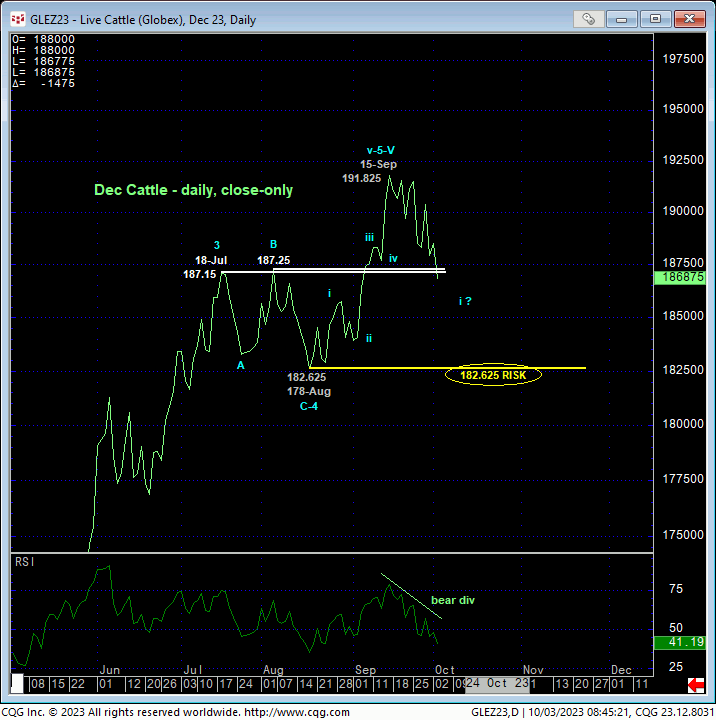
The market’s clear break today below last week’s 187.725 low and short-term risk parameter updated in yesterday’s Technical Blog is far from a sufficient scale to conclude the end of the secular bull market. But by confirming a bearish divergence in daily momentum and along with compelling ancillary evidence, it is more than sufficient to identify 19-Sep’s 192.05 high as one of developing importance and even yesterday’s 190.25 high as a smaller-degree corrective high and short-term parameter from which the risk of non-bullish decisions like long-covers and cautious bearish punts can now be objectively based and managed.


Indeed and as always, we cannot conclude a major top from proof of only short-term weakness. What we know is fact is that today’s break below last week’s 187.725 low confirms a bearish divergence in daily momentum that breaks Aug-Sep’s portion of the secular bull. AT LEAST the intermediate-term trend is down with a minimum recovery above yesterday’s 190.25 high now required to arrest this slide and render it another 3-wave and thus corrective affair that would then re-expose the secular bull. Until and unless such strength is proven, we anticipate at least a slightly larger-degree correction lower of indeterminable scope and possibly the early stages of a peak/reversal environment that would be massive in scope.
To threaten the secular bull market, commensurately larger-degree weakness below 18-Aug’s 181.925 larger-degree corrective low and key long-term bull risk parameter remains required. But we would remind traders that every such larger-degree mo failure begins with exactly the type of smaller-degree mo failure that was confirmed this morning. What this market as in mind between spot and that 181.925 low in the period immediately ahead is anyone’s guess at this time. However, we know for a fact that this market now needs to recoup at least yesterday’s 190.25 high to arrest the current developing slide, so our bear risk is specific and objective.
IF IF this setback is just another correction, then former lower-187-handle-area resistance from Jul and Aug shown in the daily close-only chart would be expected to hold as new support. Further weakness into the 186- or 185-handles would be the next incremental reinforcing evidence of a developing peak/reversal environment.

Finally and from a long-term perspective, the combination of:
- waning upside momentum in weekly momentum (confirmed below 181.925) amidst
- historically stratospheric sentiment/contrary opinion levels, and
- and arguably compete and massive 5-wave Elliott sequence
is unique and compelling and warns of a peak/reversal threat that could be every bit as massive as 2014’s major top and reversal. Can we conclude such a top at this juncture? Absolutely not. As with all such correction-vs-reversal debates and challenges, the key technical and trading matter of SCALE comes to the forefront. This market HAS weakened enough for shorter-term traders to move to a neutral-to-cautiously-bearish policy with a recovery above at least 190.25 and preferably 192.05 required to threaten and then negate this call and re-expose the bull. Longer-term commercial players are advised to pare bullish exposure to more conservative levels and jettison remaining exposure on commensurately larger-degree weakness below 181.925.


