Posted on Feb 21, 2023, 09:12 by Dave Toth
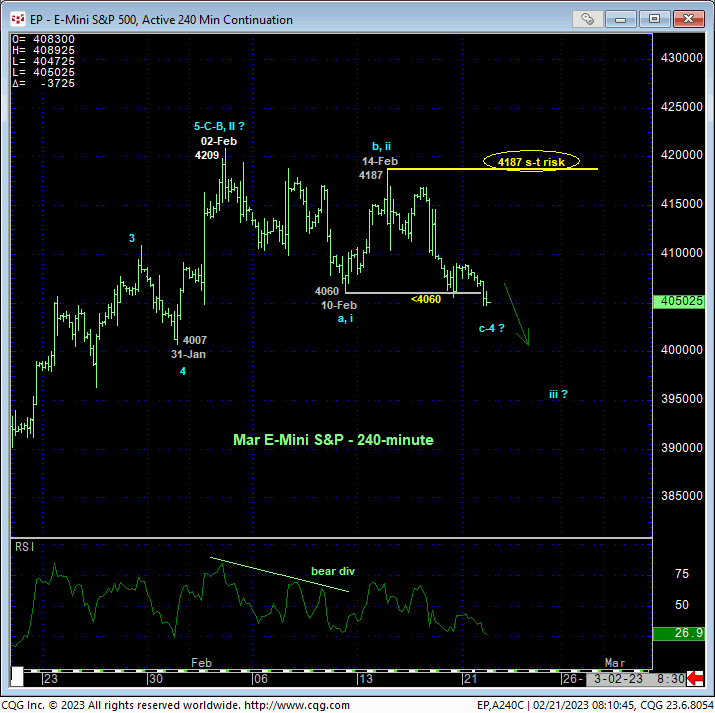
In Thur’s Technical Blog we discussed the importance of 10-Feb’s 4060 low as our new short-term bull risk parameter the market needed to sustain gains above to avoid confirming a bearish divergence in daily momentum and breaking Dec-Feb’s portion of the broader recovery from last Oct’s low. The 240-min chart below shows today’s clear break below this level and area with the important by-product being the market’s definition of last week’s 4187 high as the latest smaller-degree corrective high this market must now recoup to render the sell-off attempt from 02-Feb’s 4209 high a 3-wave and thus corrective event consistent with a longer-term bullish count. Until and unless such strength is proven, AT LEAST the intermediate-term trend is down and is expected to continue and perhaps accelerate. Per such, we’re defining 4187 as our new short-term parameter from which shorter-term trades with tighter risk profiles can objectively base non-bullish decisions like long-covers and cautious bearish punts and where longer-term investors can pare bullish exposure to more conservative levels.
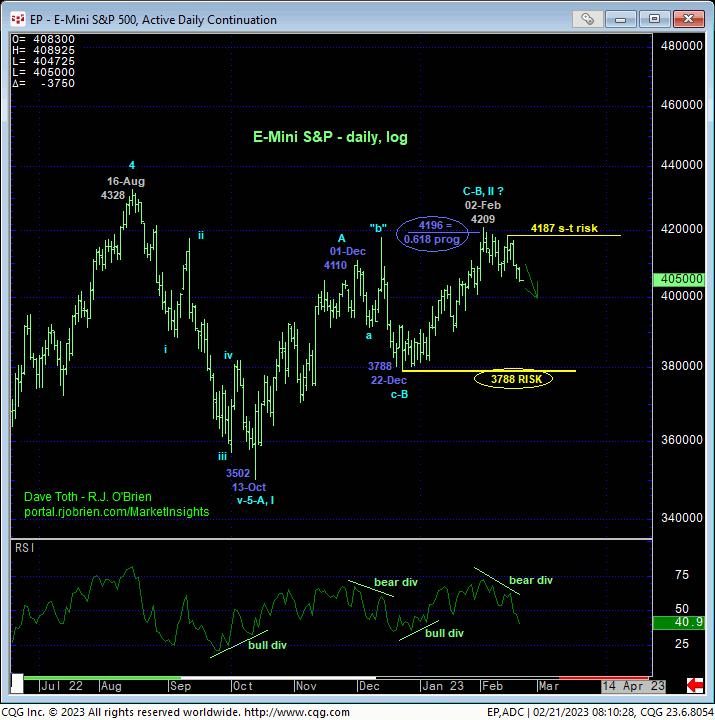
Stepping out to a daily scale, both the high-low log chart above and close-only log chart below show the bearish divergence in momentum resulting from the past couple days’ break below 10-Feb’s 4060 initial counter-trend low that, in fact, breaks the uptrend from 22-Dec’s 3788 larger-degree corrective low. This momentum failure is of too small a scale to conclude anything more at this juncture than a correction of Dec-Feb’s portion of the broader recovery from 13Oct22’s 3502 low. BUT IF this month’s decline is only such a correction, then somewhere along the line the market MUST recoup 14-Feb’s 4187 smaller-degree corrective high.
From a geeky Elliott Wave perspective, the decline from 4187 can be only one of two things: the c-Wave of a bull market correction or the 3rd-Wave of something more protracted to the downside, including the possible break of 22-Dec’s 3788 larger-degree corrective low. And what’s crucial about that 3788 low is that a failure below it will render Oct-Feb’s broader recovery a 3-wave and thus corrective affair that would re-expose 2022’s major bear market to eventual new lows below 3502. No, we cannot conclude such a broader bearish count from proof of only intermediate-term weakness below 4060 the past couple days. But we CAN conclude last week’s 4187 high as a short-term but specific and reliable parameter from which the risk of non-bullish decisions like long-covers and cautious bearish punts can now be objective based and managed.
Ancillary factors that would/could be consistent with a broader bearish count include:
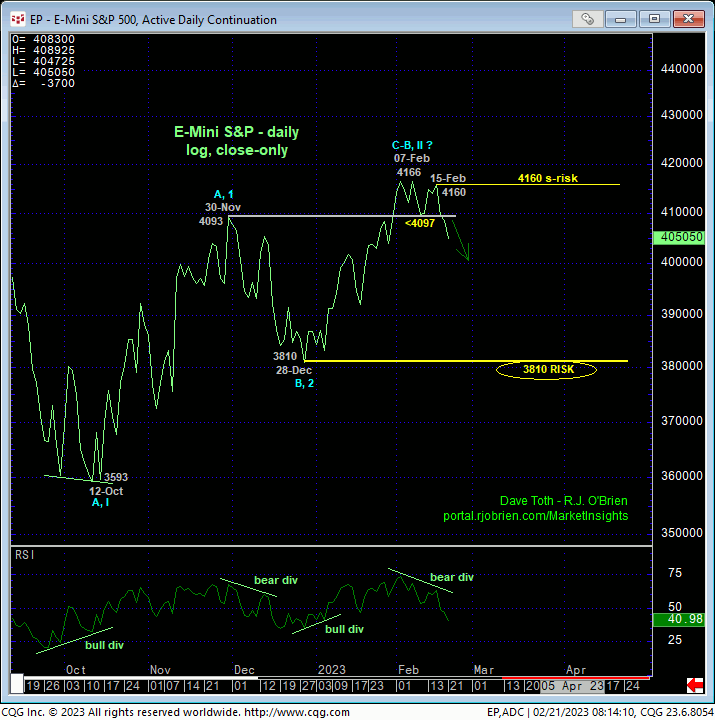
- the market’s failure thus far to sustain early-Feb’s breakout above 30-Nov’s 4093 high on a daily close-only basis below and
- the Fibonacci fact that the rally from 22-Dec’s 3788 low came within 13-pts of its 0.618 progression relationship to 13-Oct-to-01-Dec’s preceding 3502-to-4110 rally (assuming that 13-Dec’s rogue 4180 high was the b-Wave ‘irregular” within a correction from 4110 to 3788 as labeled above).
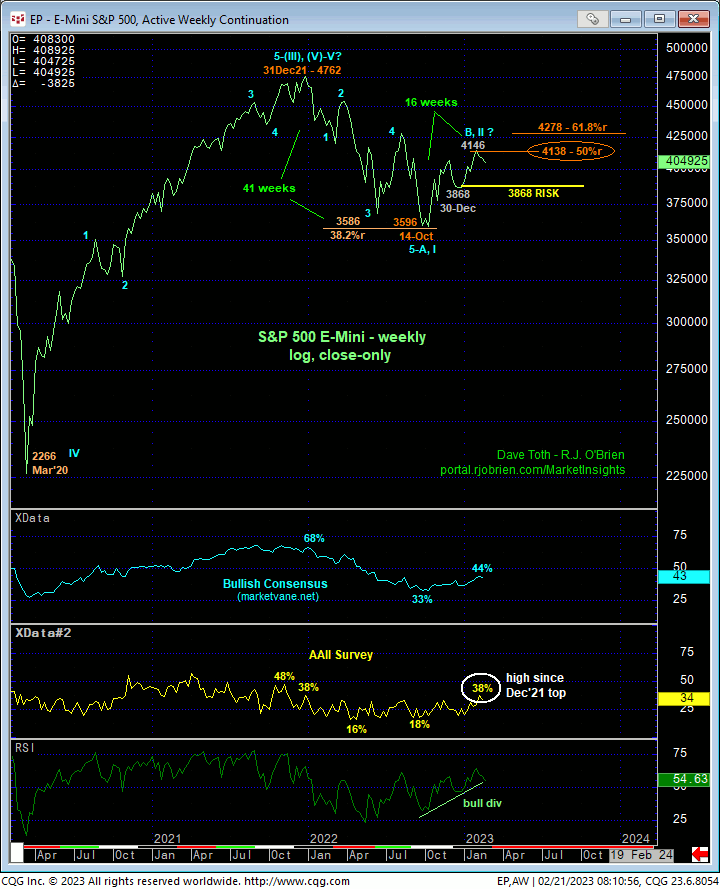
On a broader scale, the weekly log close-only chart below shows the market’s 50% retrace of last year’s entire 4762 – 3596 decline. This recovery attempt spanned 16 weeks, exactly 38.2% of the 41 weeks the market spent last year trending lower. Additionally, this chart also shows the Bullish Consensus (marketvane.net) measure of market sentiment returning to a benign level that won’t inhibit a bigger move in either direction. Perhaps more importantly, the American Association of Individual Investors Survey has returned to bullish levels that haven’t been seen since Dec’21/Jan’22’s major top.
By themselves, none of these factors would matter much as long as the uptrend was still intact. But the past couple days’ momentum failure has threatened/compromised the uptrend until/unless the market can recoup last week’s 4187 high. Again, commensurately larger-degree weakness below 3788 remains required to re-expose last year’s major bear, but such larger-degree momentum failures always start with smaller-degree failures like todays. In effect, we believe this market has identified 4187 and 3788 as the key directional flexion points heading forward.
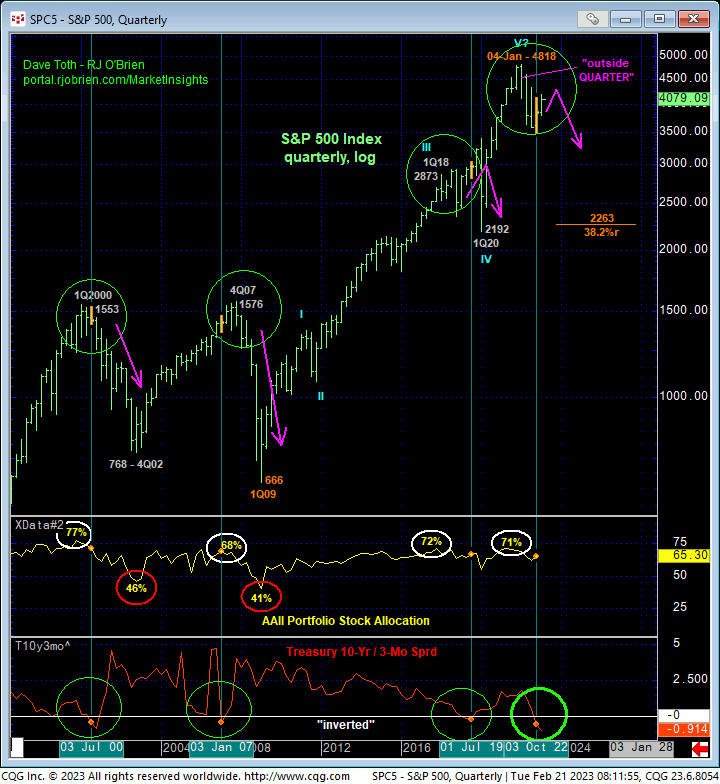
Lastly and reiterating once again, the quarterly log chart of the underlying S&P 500 Index shows two of the key elements of a major peak/reversal count from 04Jan22’s all-time high that remain intact until/unless negated by a recovery above that 4818 all-time high in the index and 4808 high in the futures contract:
- an inverted yield curve and
- an arguably complete and massive 5-wave Elliott sequence that dates from 2009”s 666 low.
There were additional peak/reversal elements in 1Q22 that don’t need rehashing here. Suffice it to say that while Oct-Feb’s recovery is not unimpressive, it remains well within the bounds of a bear market corrective rally. We cannot conclude the end of this rally from today’s relatively minor bearish divergence in daily momentum. Indeed, commensurately larger-degree weakness below 3788 is required to do so. But today’s mo failure DOES warrant increased scrutiny and awareness in the period immediately ahead. For IF this decline is the 3rd-Wave down of some more protracted to the bear side, we would expect it to be characterized by sustained, trendy, impulsive, increasingly obvious behavior to the downside. If, alternatively, the past week’s slide is the completing c-Wave of a correction within the still-developing recovery from last Oct’s low, then the market needs to recoup last week’s 4187 high.
These issues considered, shorter-term traders have been advised to neutralize any/all bullish exposure and are further advised to consider a cautious bearish stance with a recovery above 4187 required to negate this call and warrant its cover. Longer-term institutional players and investors are advised to pare bullish exposure to more conservative levels and neutralize remaining exposure on a failure below 3788.