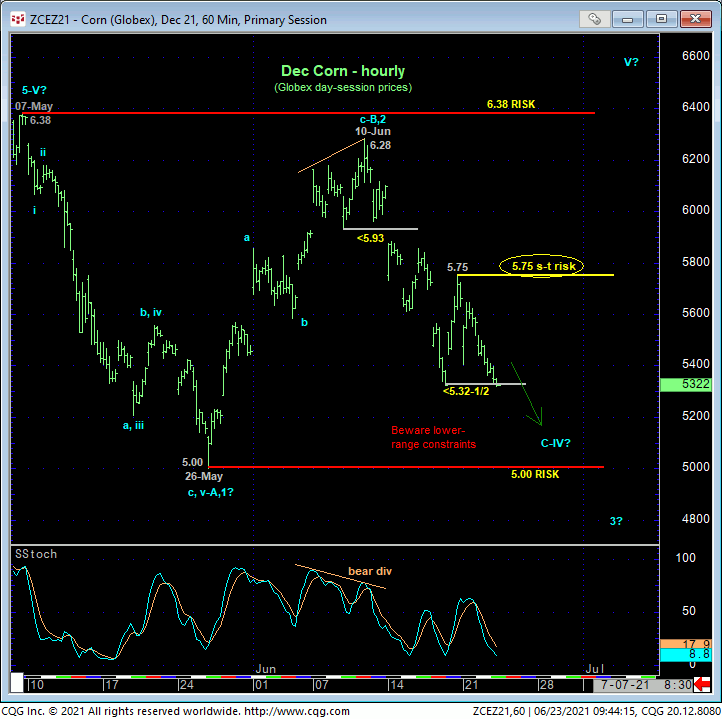
On a shorter-term basis, today’s break below last week’s 5.32-1/2 low and support reaffirms at least our short-to-intermediate-term bearish count discussed in 14-Jun’s Technical Blog following that morning’s bearish divergence in short-term momentum that ended late-May/early-Jun’s recovery attempt at 6.28 and exposed at least another intra-range relapse. Today’s continued slide leaves Fri’s 5.75 high in its wake as the latest smaller-degree corrective high and new short-term risk parameter this market is now minimally required to recoup to threaten a more immediate bearish count. Per such, this 5.75 level serves as our new short-term risk parameter from which shorter-term traders with tighter risk profiles can objectively rebase and manage the risk of an advised bearish policy and exposure.


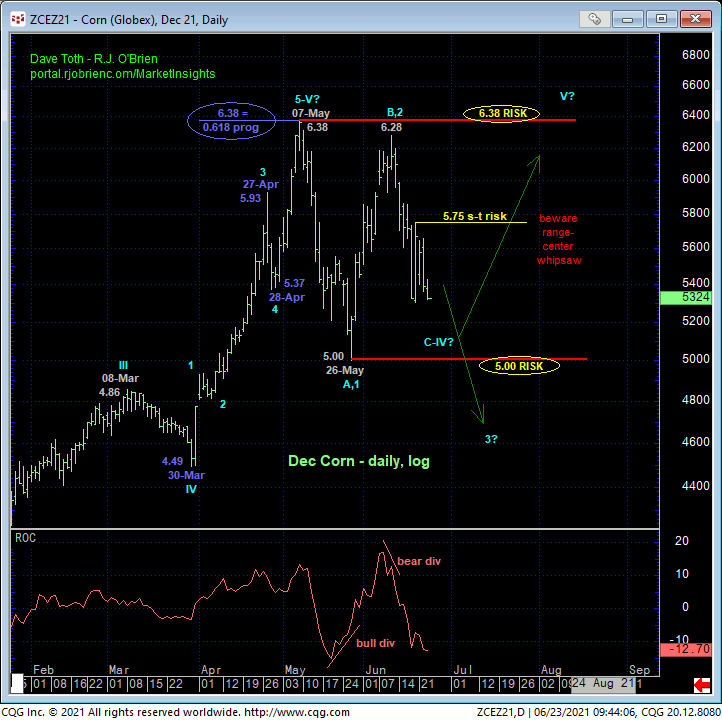
This tight but objective risk parameter at 5.75 may come in handy given the debate over whether the decline from 10-Jun’s 6.28 high is the C-Wave of a 4th-Wave correction from 07-May’s 6.38 ahead within the still-unfolding secular bull trend OR the dramatic 3rd-Wave of a major reversal lower that’d be expected to blow away 26-May’s 5.00 low. The former bullish count would likely have to include a bullish divergence in momentum from some level north of 26-May’s pivotal 5.00 low. The latter bearish count would be characterized by sustained, trendy, impulsive price action lower straight away. The market’s inability to sustain recent losses below 5.75 would tilt the directional scales higher. Until at least such 5.75+ strength is shown, and especially following a break below 5.00, a major reversal lower has to be considered.
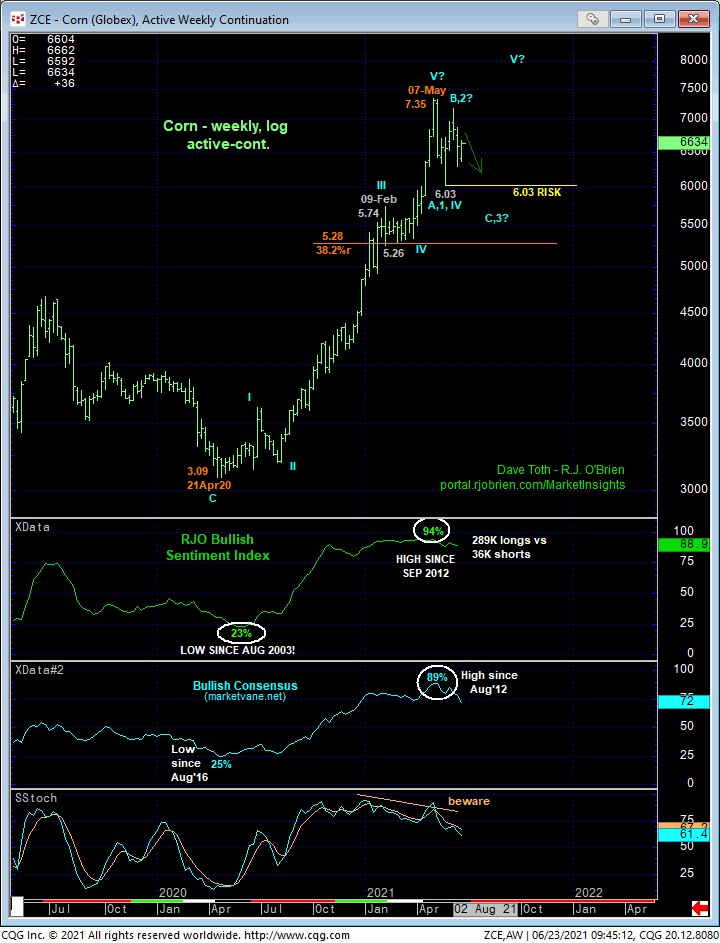
On a broader weekly log scale basis below, we can debate whether 07-May’s 7.35 high in the Jul contract (6.38 in the Dec contract) completed a massive 5-wave Elliott sequence up from Apr’20’s 3.09 low. What’s not debatable is upside momentum that’s been waning all year and historically stratospheric sentiment/contrary opinion levels typical of major peak/reversal environments. Indeed, at a current 89% reading reflecting a whopping 289K Managed Money long positions to just 36K shorts reportable to the CFTC, our RJO Bullish Sentiment Index indicates ample fuel for downside vulnerability should the overall market force the capitulation of this community’s long exposure.
Getting back to the Dec contract above, it is clear and simple that 6.38 and 5.00 have identified the absolutely key boundaries and directional flexion points around which longer-term commercial players can and should toggle directional biases and exposure. For the time being and until/unless this market recoups at least 5.75, our longer-term bias is with the bear and an eventual collapse below 5.00.

PRODUCER BEAR HEDGE: AUG SHORT-DATED 5.40 – 5.10 PUT BACK SPREAD
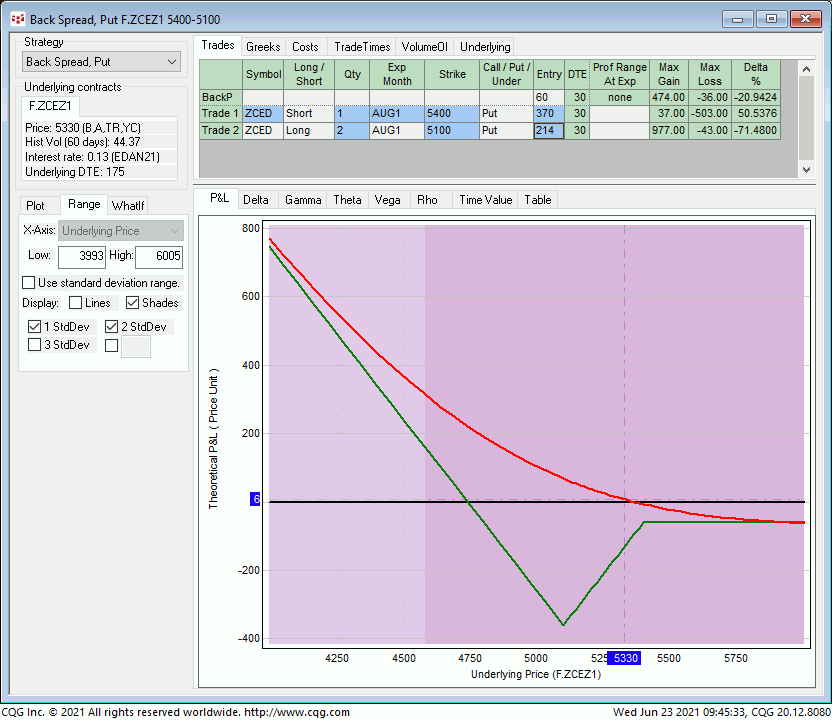
For producers who have to prioritize downside risk, especially ahead of next Wed’s key crop reports, we believe the Aug Short-Dated 5.40 – 5.10 Put Back Spread is a most appropriate bear hedge strategy. This strategy is based on the technical premise that the underlying Dec contract is most likely to do one of two things: either collapse quickly and completely in a 3rd-Wave down OR find a 4th-Wave bottom around the lower-quarter of the past month-and-a-half’s range ahead of a major 5th-Wave resumption of the secular bull. In other words, this strategy is based on the likelihood of this market MOVING AWAY FROM current 5.30-to-5.20-area prices in the week or two ahead. This is why the greatest 36-cent risk/cost to this strategy will only be incurred if the underlying Dec contract settles at 5.10 at expiration 30m days from now on 23-Jul.
This strategy involves selling 1-unit of the Aug Short-Dated 5.40 Puts around 37-cents and buying 2-units of the Aug Short-Dated 5.10 Puts around 21-1/2-cents for a net cost of 6-cents and provides:
- a current net delta of -21%
- favorable margins
- maximum and fixed risk of only 6-cents on ANY resumption of the secular bull trend above 5.40
- maximum risk/cost of 36-cents if the underlying Dec contract settles at 5.10 30 days from now on 23-Jul
- virtually unlimited, dollar-for-dollar downside hedge protection below its 4.74 breakeven point at expiration.
In the P&L graph below, the red line shows P&L today while the green line shows P&L at expiration. While the key, likely-market-moving crop reports are a week away, there is plenty of time between that day and expiration of the Aug short-dated options for this market to show its directional hand. If, in the week following the report, this market continues to merely waft lateral around the 5.10-area, this strategy can be covered in favor of a newly-structured strategy around potentially new technical flexion points and condition.
Please contact your RJO representative for an updated bid/offer quote on the Aug Short-Dated 5.40 – 5.10 put Back Spread.


