Posted on Apr 11, 2023, 07:59 by Dave Toth
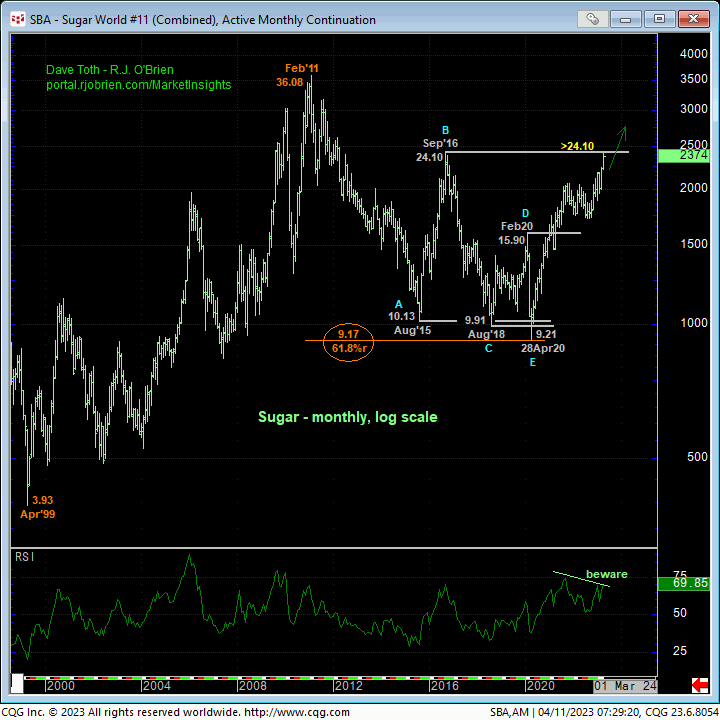
With overnight’s poke above Sep 2016’s 24.10 high, the monthly log chart below shows this market’s highest prices since Apr 2012. The trend remains up on all scales with NO levels of any technical merit above the market shy of 2011’s 36.08 all-time high. This doesn’t mean we’re forecasting a move to a 36-handle, but it certainly does mean that this market’s upside potential is indeterminable and potentially extreme until and unless countered by a bearish divergence in momentum of a scale sufficient to threaten the bull.

The weekly log active-continuation chart below shows not only the past couple weeks’ decisive, impulsive obliteration of Feb’s 21.89 high that reaffirms the secular 3-YEAR bull market, but also the resumption of the portion of the bull from last Sep’s 17.19 low that’s arguably ACCELERATING, warning of a 3rd-Wave “extended” move from 09-Jan’s 17.89 (2nd-Wave) low. If correct, this wave count portends steep, protracted, even relentless strength straight away. On this scale, a failure below at least former 21.89-to-21.33-area resistance-turned-support is MINIMALLY required to mitigate a long-term bullish count that may have miles to go.

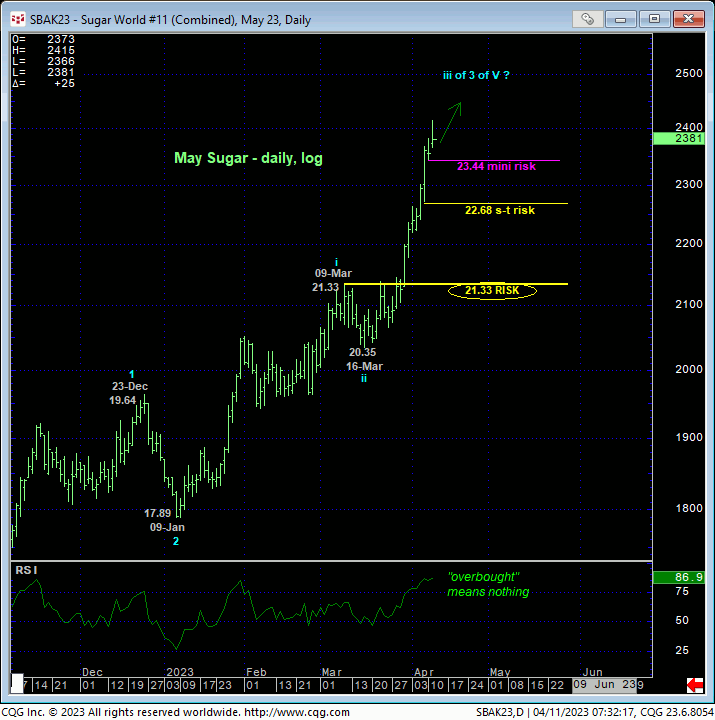
The daily log scale chart of the May contract below shows the accelerated nature of the past couple weeks’ portion of the bull that has 3rd-Wave “extension” characteristics. To jeopardize the impulsive integrity of such a count, a failure below 09-Mar’s 21.33 suspected smaller-degree 1st-Wave high is required. Per such, we’re defining 21.33 as our new key long-term bull risk parameter pertinent to longer-term commercial players.
This daily perspective also provides the latest example of the uselessness of ever describing a market as “overbought” just because a measure of momentum, like the Relative Strength Index, ticks at a level like 75%. “Overbought” and “oversold” are accusations and descriptions that are outside the bounds of technical discipline.

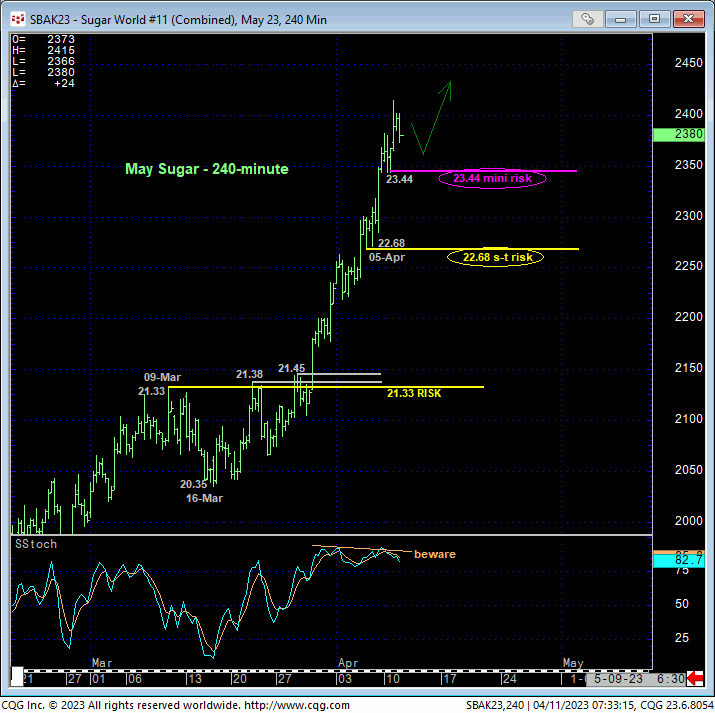
Drilling down to a very short-term basis, the 240-min chart below shows smaller-degree corrective lows at 22.68 and 23.44 that this market is now required to fail below to even defer, let alone threaten the secular bull trend. These levels are considered our new short-term and mini bull risk parameters pertinent to short-term traders with tighter risk profiles, acknowledging the whipsaw risk within the secular bull trend that understandably comes in exchange for such tighter risk parameters under such bullish conditions.
These issues considered, a bullish policy and exposure remain advised with failures below 23.44 and/or 22.68 required for shorter-term traders with tighter risk profiles to pare or neutralize exposure and circumvent the depths unknown of another interim correction within the secular bull trend. Whipsaw risk comes in exchange for these tighter risk parameters. Commensurately larger-degree weakness below 21.33 is required for long-term commercial players to follow suit. In lieu of such weakness, the trend is up on al scales and should hardly surprise by its continuance.


