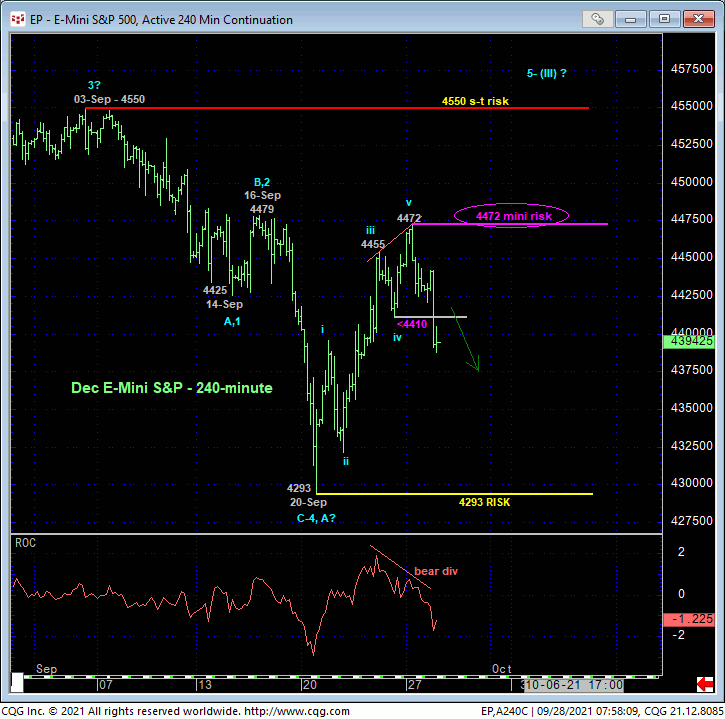
In yesterday’s Technical Blog we discussed Fri’s 4410 corrective low as a very minor risk parameter the market needed to stay above to maintain the uptrend from 20-Sep’s key 4293 low and long-term risk parameter. The 240-min chart below shows the market’s failure below 4410, defining yesterday’s 4472 high as the end of the rally from 4293 and our new mini risk parameter the market now needs to recoup to resurrect the intra-4550-to-4293-range recovery and possibly the secular bull market. What the market has in store for us between 4410 and 20-Sep’s pivotal 4293 low is anyone’s guess. But given a backdrop of sharply rising interest rates of late, traders are warned not to dismiss this morning’s admittedly short-term weakness as an early indication of further erosion below 4293.
To be sure and as we’ve discussed forever, the middle-half bowels of an established range are rife with aimless whipsaw risk where the risk/reward merits of initiating directional exposure are poor. This describes the past few days’ price action perfectly and may just be reinforcing proof of lateral, corrective, consolidative price action from 03-Sep’s 4550 high ahead of the eventual resumption of the secular bull trend above 4550. But if this is the case, then this market needs to arrest this week’s slide with a bullish divergence in momentum from some level above 4293 and then recoup 4472. Such evidence would be very helpful to a long-term bullish count. IF, alternatively, this market continues to erode and breaks below 4293, we believe the market’s longer-term downside potential could be major in scope.


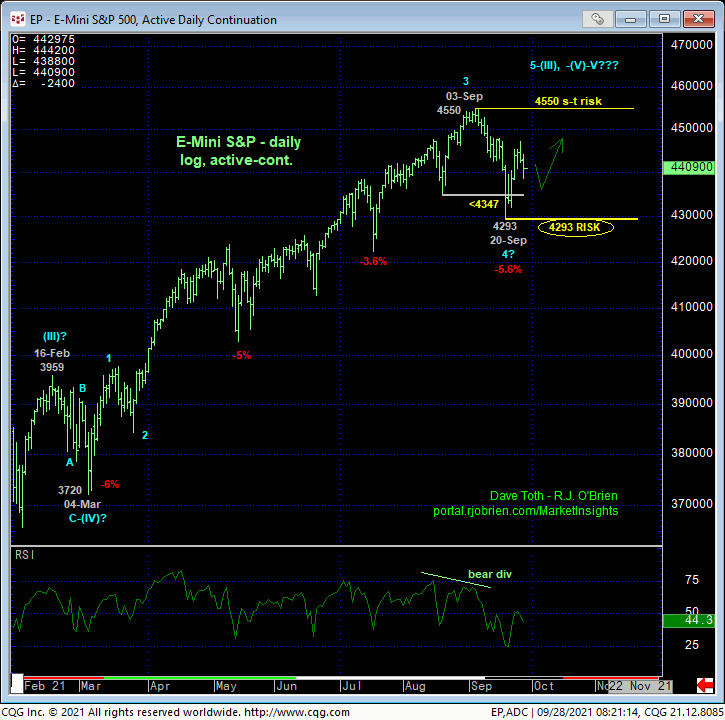
Stepping back to consider this market’s longer-term construct and as recently discussed, 20-Sep’s bearish divergence in daily momentum below 19-Aug’s 4347 corrective low defines 03-Sep’s 4550 high as one of developing importance and clearly the level this market now needs to recoup to reinstate the secular bull trend. This month’s 5.6% setback is one of the bigger setbacks over the past year, but until and unless this setback resumed below 20-Sep’s 4293 low, it remains well within the bounds of another mere correction consistent with a continued long-term bullish count.
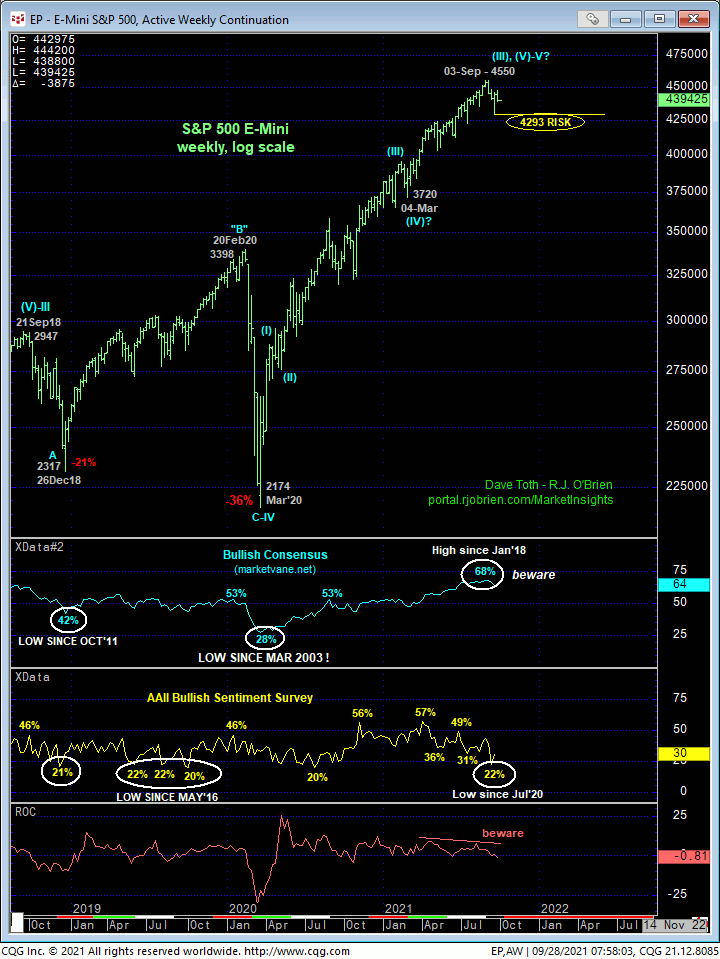
IF, alternatively, the market re-weakens below 4293, it will render that 4293 low and initial (A- or 1st-Wave) counter-trend low, confirm a bearish divergence in WEEKLY momentum and expose a correction or reversal lower that may be major in scope given historically frothy bullish sentiment levels. The weekly log chart below shows the recent 68% reading in the Bullish Consensus being its highest, most frothy level in nearly four years. Oddly however, the AAII Bullish Sentiment Survey has been dawdling around historical LOWS recently, which we would NOT expect in a peak/reversal-threat environment. Indeed, the huddled masses are typically frothing at the mouth with bullish emotion when the market’s posting a major top.

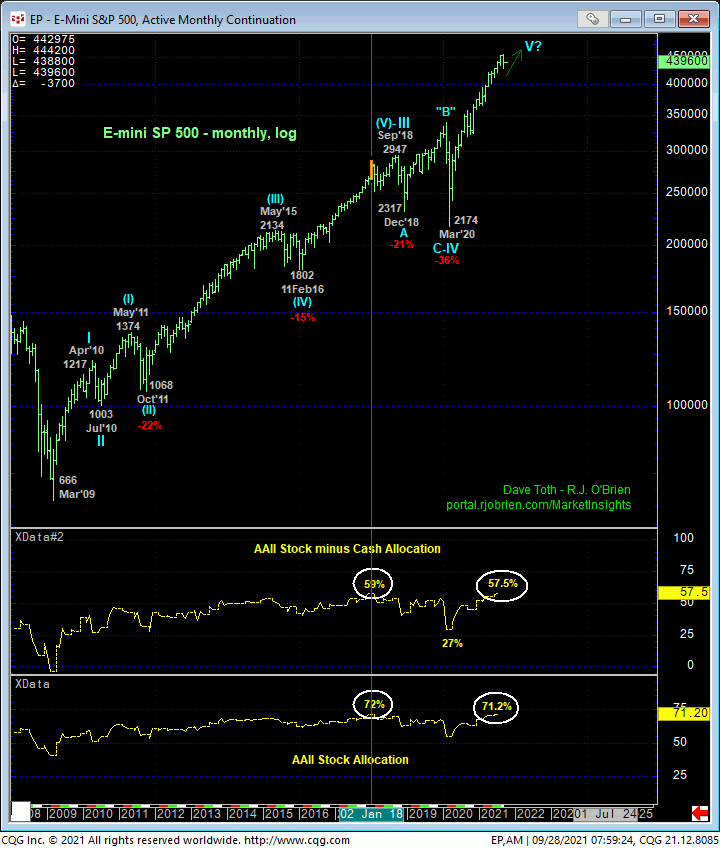
On an even broader scale, the monthly log chart below shows the sheer magnitude of the secular bull trend that would require weeks or even months of peaking behavior to suggest a top. A case can certainly be made that the rally from Mar’20’s 2174 low is the completing 5th-Wave to a massive sequence that dates from Mar 2009’s 666 low, but again, the evidence required of such a peak/reversal process is massive, not a piddly 5.6% setback.
This said, this monthly chart also shows historically extreme levels of stock and stock-to-cash portfolio allocations that have warned of and accompanied major tops before, so it’s not hard to find evidence typical of more significant tops that, in this case, places terrific emphasis on 20-Sep’s 4293 low, the break of which will be the next reinforcing step to a broader correction or reversal lower.
These issues considered, a neutral/sideline position remains advised for shorter-term traders given the poor risk/reward metrics from the middle-half of this month’s 4550 – 4293-range. A bullish policy and exposure remain advised for longer-term institutional traders and investors with a failure below 4293 required to negate our bullish count and warrant an immediate move to a neutral/sideline position in order to circumvent the depths unknown of further correction or reversal lower that could be major in scope. A recovery above yesterday’s 4472 high would allay broader peak/correction/reversal threats and give the bull the chance to perform.


